This is a revised examination of a measurement of how individual transit routes contribute to overall access in Seattle. The first attempt was subject to a computational error that caused incorrect figures to be reported for certain routes. This iteration fixes that issue, and also uses updated schedules for King County Metro and Sound Transit that will take effect on September 14th.
The first version was presented in a series of parts. In each part, I chose a group of thematically similar routes and computed five measurements for them. I now find this approach to be somewhat clunky. These measurements don’t have clear “good” or “bad” values; they are only useful in comparison. Thus, it was difficult to meaningfully evaluate the routes chosen in the early part of the series. This revision presents all routes at once.
Twice a year, King County Metro revises its bus service. Most of the time, the revisions are small. Fluctuations in funding and the workforce may cause a few trips to be added or deleted, and construction projects may necessitate minor changes to routes. Often, the service revision is a non-event for riders, and the access implications are miniscule.
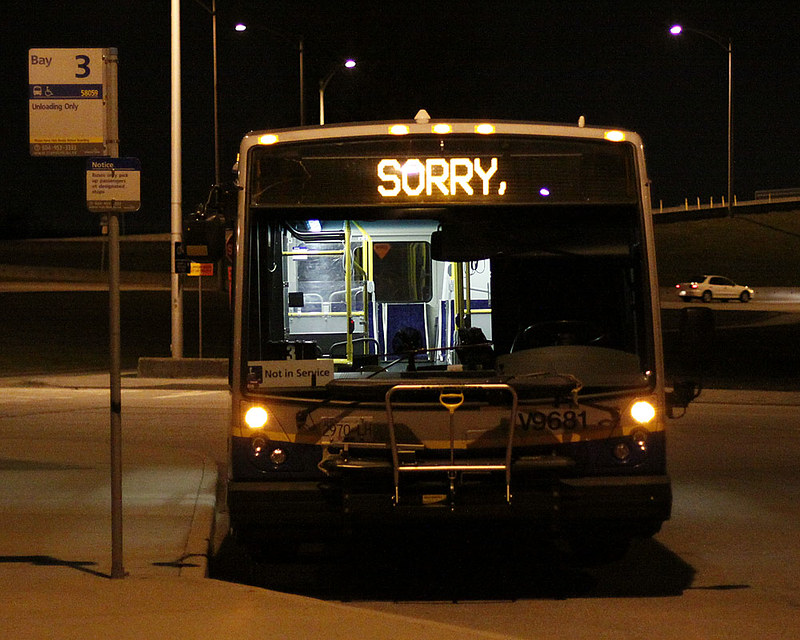
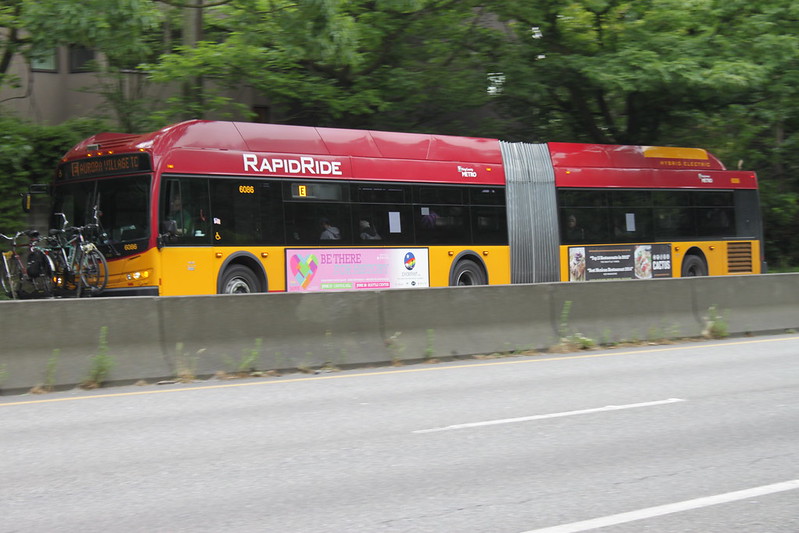
When Metro does make big changes, they’re typically in response to external factors. On September 14th, the agency will make its most substantial set of modifications in a few years. Sound Transit’s Lynnwood Link extension is opening at the end of August, and some Metro routes in North Seattle and Shoreline will change to connect to the new stations. Also, the construction of transit-priority features on Madison Street will be complete, enabling the launch of the RapidRide G Line. Some routes in that line’s vicinity will see changes as well. Amidst these additions and modifications are deletions of bus service from some corridors. This is a move that the agency has typically seemed loath to make. Often, cuts like this appear in early versions of a service revision, only to be rolled back when the agency receives complaints. While the deletions typically are intended to enhance service elsewhere, transit customers are loss-averse, and Metro is usually sensitive to negative feedback to a fault. In this case, some significant cuts survived several rounds of scrutiny.
Last week, Metro updated its GTFS schedules to incorporate the forthcoming service change. That allowed me to compute access measurements that reflect what riders in Seattle will experience when the new routes start running. If they are to be believed, riders are in for a mixed bag. For a service change that finally makes investments in new service after a pandemic and workforce shortages, that’s disappointing.
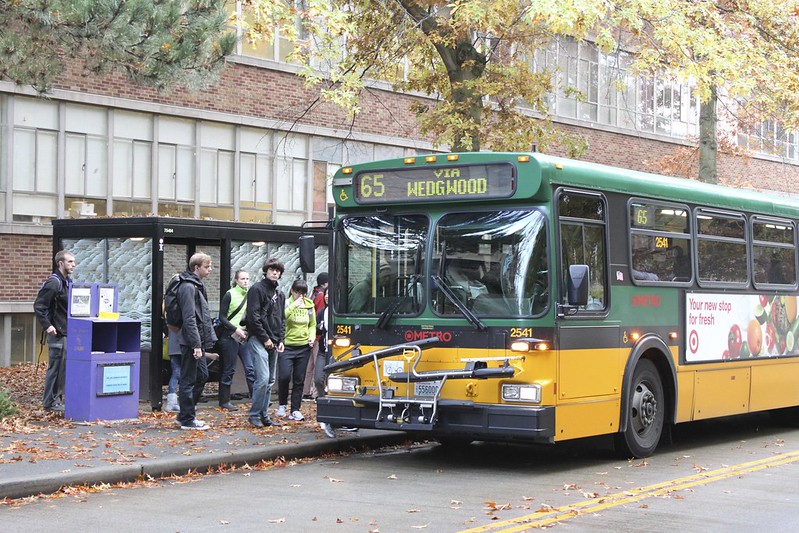
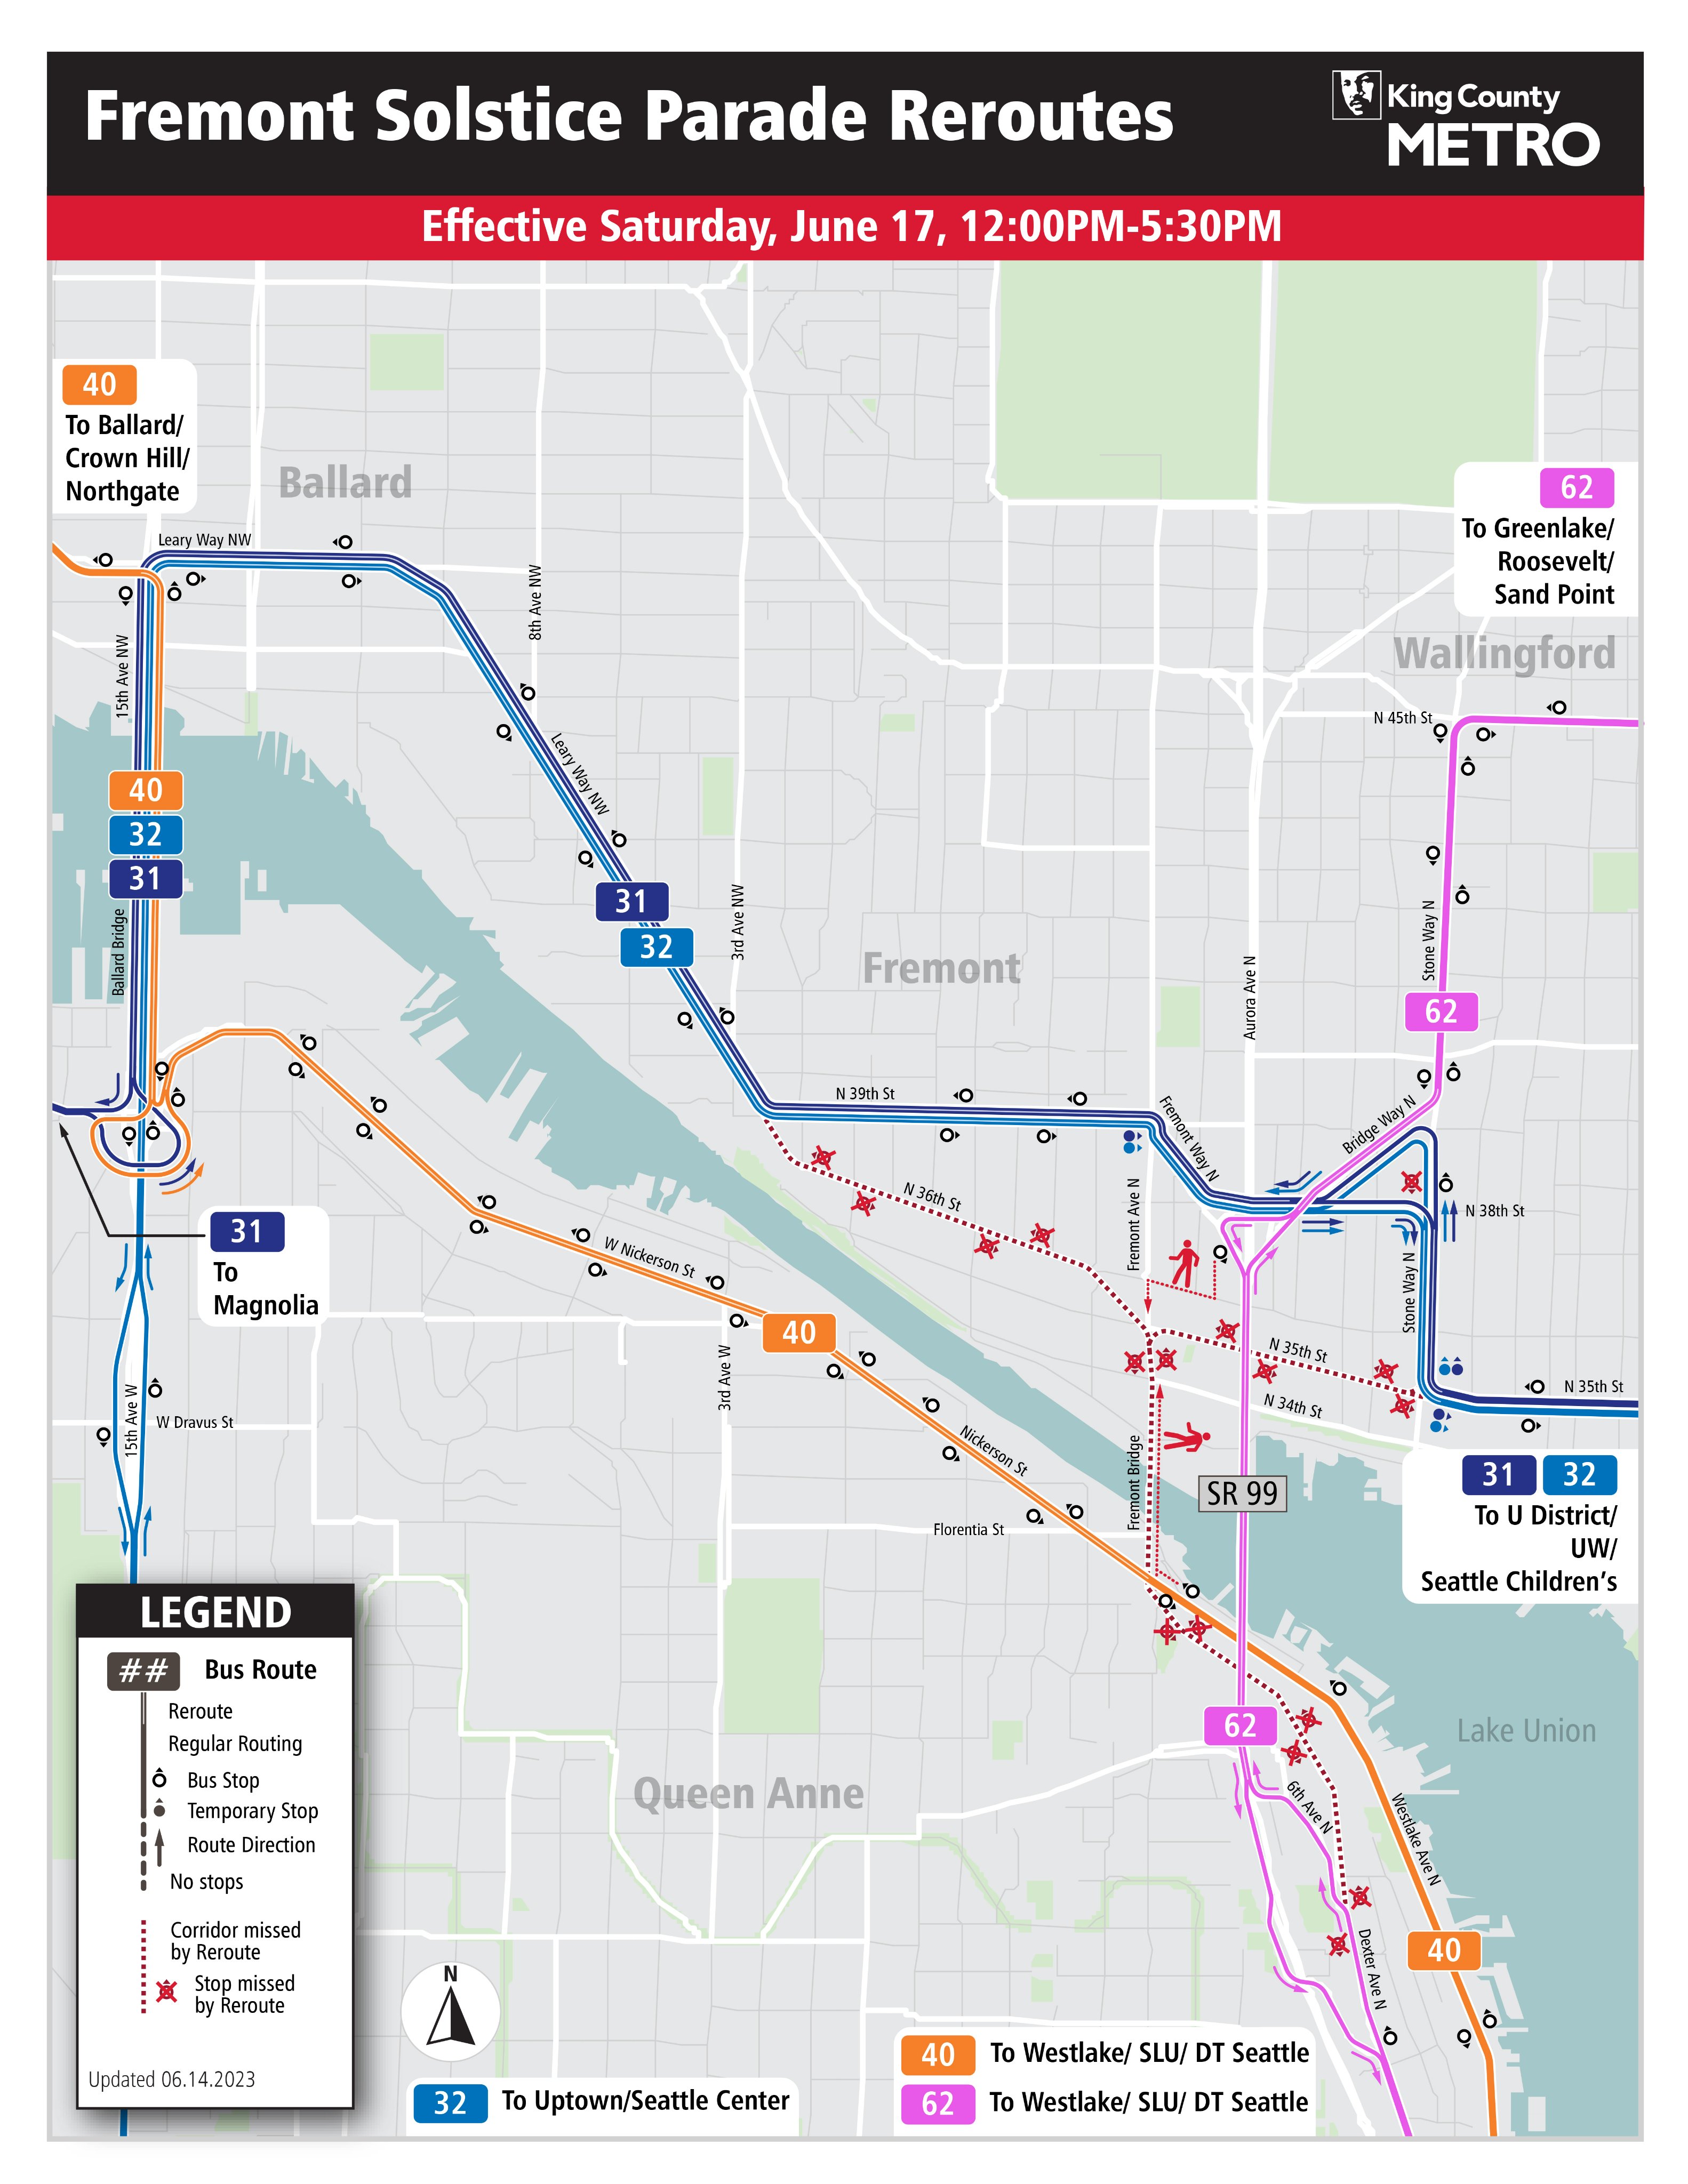
When the annual Fremont Solstice Parade celebrates the arrival of summer, King County Metro must reroute its buses around it. Routes 31, 32, 40, and 62 serve Fremont, and the parade forces them off their typical paths.
I was intrigued by the detours. The routes weren’t just avoiding the parade, they were bypassing the Fremont Bridge entirely. Mass transit has used the Fremont Bridge since its opening in 1917. It was built with two lanes of streetcar tracks on it. In spite of this precedent, I couldn’t help but wonder if Metro’s service could be better if no routes crossed it at all.
This is an updated proposal for transit service in Seattle that exceeds King County Metro’s definition of frequent service on all routes 24 hours per day, 7 days per week. Compared to its predecessor, it incorporates some changes to mitigate potential overcrowding, and, more importantly, uses a corrected budget of in-service transit hours. Correctly assessing, and holding to, this budget is critical for this proposal. In-service hours drive agency operating costs. As tempting as it is to imagine what a better-funded King County Metro could accomplish, I fear that not holding to a budget would push a proposal that is already ambitious and challenging into the realm of the totally impractical. As the budget of in-service hours is about 12% less than previously thought, the resultant route map looks sparser. Some bus routes that many people use daily would disappear, without direct replacement, under this proposal.
Removing existing routes is bound to be unpopular. Why consider it when running routes with uniform headways throughout the day and night is unheard of among transit agencies? I assert that their choice not to do so contributes to automobile dependence. I made this argument in more detail when I debuted the initial proposal. In short, if a person fears that relying on public transit will eventually leave them in a situation where they desperately need to make a trip, but can’t in a reasonable amount of time, they will prioritize purchasing a car. Once a person owns a car, the marginal cost of each use is low, compared to the fixed acquisition and maintenance expenditures. It will get used even for trips that could be reasonably made with transit. The increased congestion undermines transit that shares right-of-way with private vehicles. It can even hinder attempts at constructing dedicated right-of-way, since construction decisions will favor minimal traffic disruption over optimal station placement. As unusual as uniform frequency may seem to a transit planner, I believe that it is a necessary ingredient in a transportation system where fixed-route public transit is intended to largely supplant, not supplement, private vehicle use.
Due to a software error, the in-service time amounts computed for transit networks in previous posts are inaccurate. Posts where an access measurement is used on its own are not affected. When access is expressed in terms of the amount of in-service time—whether for the entire network or an individual route—this quantity may be incorrect. In specific, these posts are impacted:
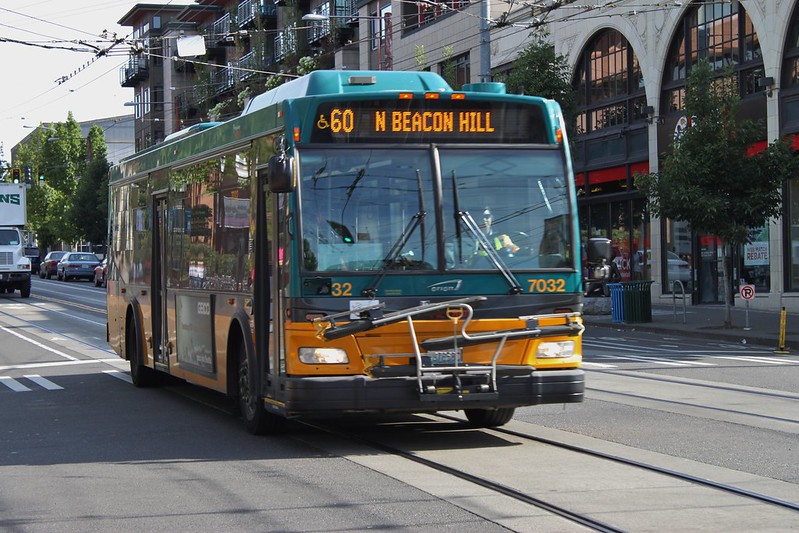
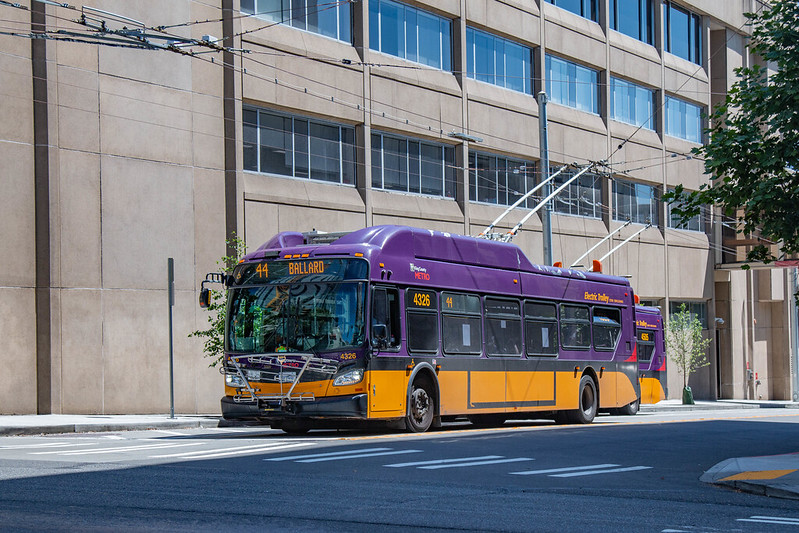
This installment of the access-based route productivity series focuses on four routes that serve Seattle’s Capitol Hill neighborhood, but are otherwise quite varied. Three of these routes skirt downtown, but one passes through Capitol Hill on its way there. Two meet Metro’s definition of frequent, one runs less frequently but all day, and one is the rare example of a peak-only route not oriented around downtown. The variation continues in the positions of routes 8, 9, 11, and 60 within Metro’s ridership-oriented route productivity measurements, and my access-based ones.
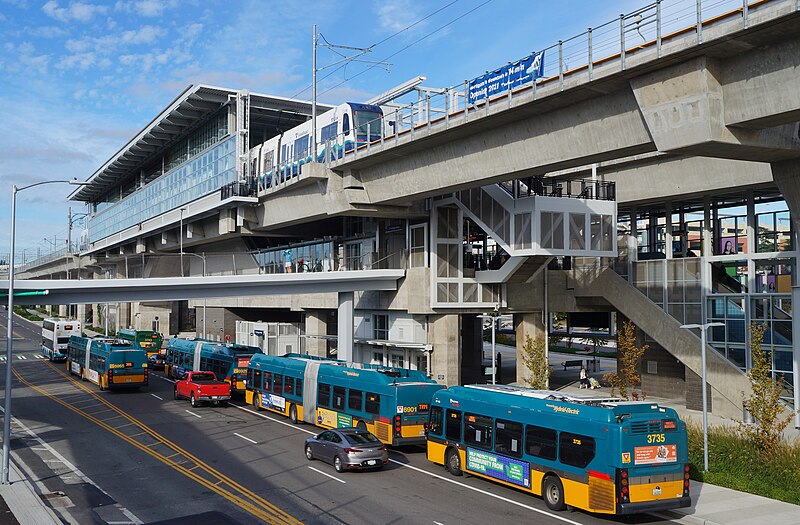
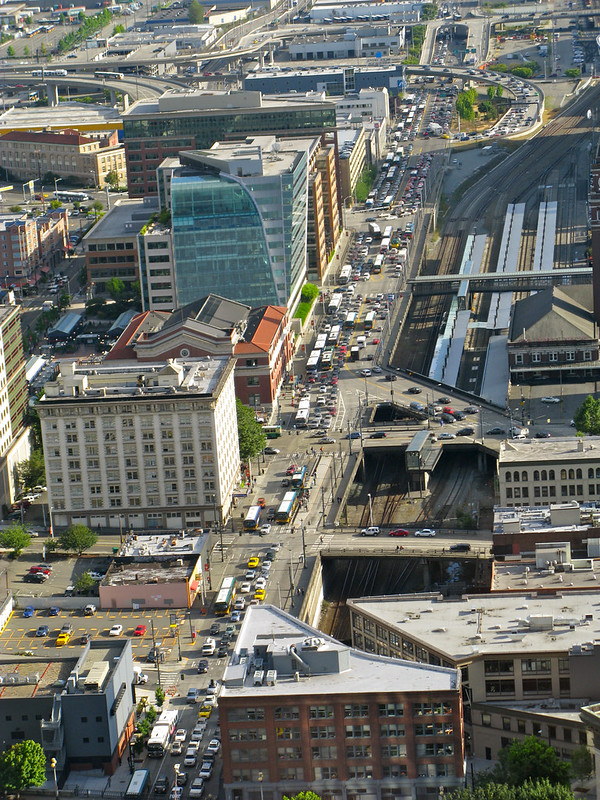
“How many buses can you count in this photo?” by Oran Viriyincy is licensed under CC BY-SA 2.0.
Decisions in public transit are often framed as tradeoffs. Should transit service cover a broader area, or should fewer routes run more frequently? What times of day, or days of the week, should see the greatest allocation of service? Rarely will one outcome be superior to another in all ways, for all people. This is the unfortunate reality when limited funding is a hard constraint.
An access measurement comparison, in its most condensed form, doesn’t present an obvious tradeoff. The consequences of any decision are rendered in the form of a single score. Good decisions increase the score, bad decisions decrease it. Of course, this is an oversimplification. The overall access measurement is the composition of many scores. An agency may achieve its greatest overall access by concentrating all of its routes into a section of its service area, but those who must leave that section will be justifiably upset.
The restructured transit network for Seattle that I produced—with uniform frequency meeting or exceeding King County Metro’s definition of frequent service on all routes, all day, every day—increased overall access while using no more in-service hours than the existing network. I nevertheless sought to be cognizant of how this would affect access throughout the city. While some parts of Seattle would see a decrease in access, the losses would be neither severe nor widespread. That still doesn’t cover every way that a restructure could disparately impact riders.
Measuring a route’s access-based productivity involves creating a hypothetical transit network in which the route doesn’t exist. For the two routes in this installment of the series, elimination is anything but hypothetical. In preparation for the Lynnwood Link extension, King County Metro will be revising its transit service in North Seattle and Shoreline. Routes 20 and 73 are technically being replaced by new routes 61 and 77, not deleted. In reality, significant portions of their paths through Seattle are losing transit service entirely.
In my 12 years in Seattle, I’ve observed that Metro is reluctant to entirely remove transit service from corridors. The route serving a corridor may change, based on a desire to connect neighborhoods to different resources (typically new Link stations), but total elimination is a rare proposition. When initial plans have included route deletion, they are often walked back, at least in part. The cuts to routes 20 and 73 have survived the full public comment and county council approval processes.
When I last looked at access-based route productivity, I found that a sample of Metro’s conventional bus routes nearly-categorically outperformed a selection of trolleybus routes. The type of vehicle wasn’t the only difference between the two groups, though; they each had a geographic bias. The trolleybus routes all serve Queen Anne Hill; the conventional buses connect downtown Seattle and neighborhoods to its north by way of the Aurora Bridge.
I previously warned about the negative consequences of using mode to judge the effectiveness of transit routes. But the trolleybus routes considered to this point are less valuable than the conventional routes. The reasons for that are, plausibly, due to the infrastructure that underpins them. It would not be wise, though, to rely on an incomplete and skewed result like this to make sweeping conclusions about trolleybuses as a mode. An assortment of King County Metro’s routes run under trolley wire, and there’s nothing about that that condemns them all to ineffectiveness. To demonstrate this, I calculated the same set of access-based route productivity metrics for all of the remaining trolleybus routes.
The routes in this update of the access-based route productivity series all cross the Lake Washington Ship Canal using the Aurora Bridge. Routes 5, 28, and the E Line share a common path out of downtown Seattle, cross the bridge, and then diverge. They are much more straightforward than the routes in the last installment; they largely lack the intra-route variation, twists and turns, and overlaps of the previous batch. There is a longer version of route 28 that runs during peak commute times. Aside from that, these routes basically correspond to one sequence of stops, in contrast to the aforementioned route 3, and its mess of variants.
Another thing that differentiates these routes is that they are run with conventional buses, rather than the trolleybuses used on the routes1 that have been analyzed thus far. Overall, I think that vehicle type—referred to as “mode”—gets overblown in public transit planning. Planners associate different rider behaviors with mode, rather than characteristics like frequency or dedicated right of way. In some cases, the mode does influence that nature. There is a stark difference in the access-based route productivity measurements between this batch of routes and the previous ones, and perhaps something about the infrastructure that underpins them does play a role.