Due to a computational error, the data and conclusions in this post may not be accurate.
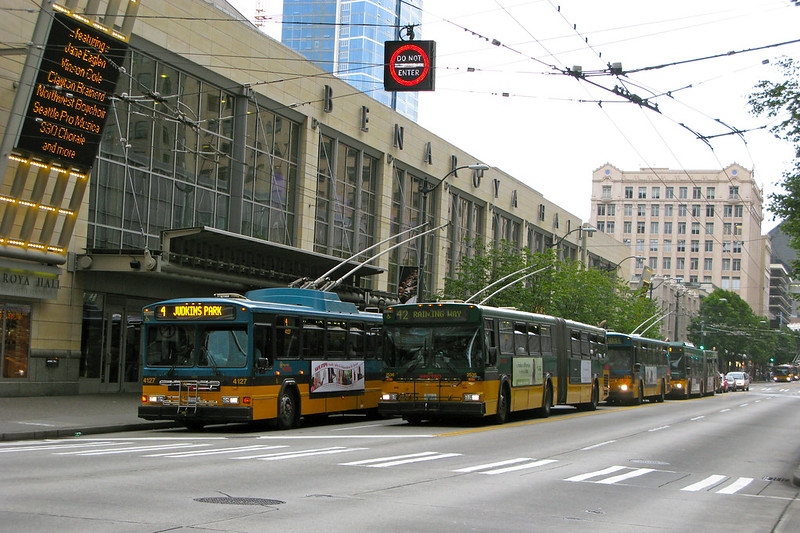
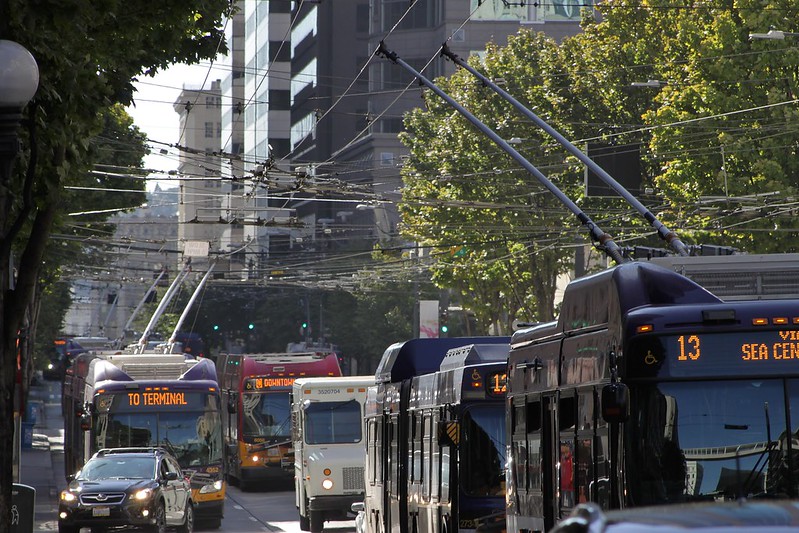
“Buses in front of Benaroya Hall” by Oran Viriyincy is licensed under CC BY-SA 2.0.
King County Metro is facing a labor shortage. Due to a lack of operators and mechanics, on September 2nd, 20 routes will be either suspended or modified to run less frequently. Routes have been chosen based on low ridership or already-high frequency, with the rationale that this will negatively impact the fewest riders. Service hours will be reduced by 3.8%.
Canceling and lowering the frequency of routes is a pragmatic way for King County Metro to decisively deal with a labor shortage. It’s also an approach that necessarily reduces the ability to access destinations via transit. I’m considering a different one. My previous examination of access across cities has convinced me that Metro’s allocation of transit service hours is subpar. By considering options beyond cancelations and frequency reductions, there could be a way to reduce the amount of service that doesn’t negatively impact overall access. This is an experiment in completely restructuring King County Metro’s transit routes in Seattle.
What I am proposing is not an immediate solution for King County Metro’s staffing problems. I know that there’s much more to restructuring transit service than drawing lines on a map. While I’ve produced a complete and realistic daily transit schedule for Seattle, it couldn’t immediately be used to run transit service. Trips need to be grouped into blocks, with breaks in between, and “cut” into runs that are chosen by transit operators. These need to follow rules stipulated by the operators’ contract. Signage would need to change, new routes would need to be tested for operability, drivers would need training. New spots would need to be carved out for buses to layover. While I have previously explained why I find rider feedback on proposed changes to be of limited value, a change of this nature would not be executed without soliciting it. On top of that, King County Metro doesn’t just operate service in Seattle. Choosing to focus on Seattle was a way to reduce the time required for both reimagining routes and performing the access analyses. I don’t think that incompleteness invalidates this experiment’s very promising results, though.
These are the first steps toward building a transit network that is in line with King County Metro’s reduced service hours, but actually improves access. It’s not something Metro can use to run reliable service in September, but it should challenge the agency to question some long-standing facets of the network that it runs. The access improvements that it entails could transform how people throughout King County view and use transit, and it demonstrates that the transformation is possible even at a time when service investment must shrink. I see no reason why this project shouldn’t inform near-term improvements to transit in Seattle, and I suspect that its design choices are portable to other locations in the county.
The Guiding Principle
I made what I suspect will seem like an unusual choice in designing this transit network. All routes run at the same frequency, and maintain this frequency all day and all night. Weekdays and weekends have the same schedule. The level of transit service is the same 24 hours per day, seven days per week. No transit system that I’ve used behaves like this, but I believe it’s critical for the health and growth of fixed-route public transit.
Running different frequencies on different routes and at different times of day is based on the principle that frequency should change according to demand. The amount of frequency factors into the capacity that is available to move people. When vehicles become overcrowded because more people are traveling, that is a sign to increase frequency by adding trips. The riders may redistribute themselves among the added trips, and reduce crowding.
Transit agencies apply this reasoning in reverse also. If a transit trip has few riders, the agency might take this as a sign to decrease frequencies on a route or at a time of day. With fewer options, riders will theoretically concentrate themselves onto fewer trips, increasing the overall load of the transit vehicles. Because of this, certain routes might end up with no overnight service, or service only during traditional commute times, due to a lack of demand.
There is a problem with this logic. Many trips are time-sensitive, and as frequency decreases, public transit is less likely to be able to transport a person to their destination at the time that they desire to be there. Not wanting to waste time by arriving long before needing to be there, the individual may use a different means of transportation to make the trip, or not make it at all. This makes transit demand for a route or traveling at that time of day appear to be even lower, possibly triggering further frequency reductions. In reality, there is demand; it’s just not being witnessed because the increasingly low-frequency transit is an increasingly inconvenient way to make the trip.
While transit agencies seem to loathe the idea of empty buses and trains—admittedly it’s not a great use of energy to move a large vehicle around for no one’s immediate benefit—I suspect the consequences of scaling down frequencies are worse. A bus running at 2:00 AM on a Tuesday might be nearly-empty more often than not. Its presence, though, represents the ability to get around using transit at 2:00 AM on a Tuesday, if that need were to ever come up. A individual who fears that transit won’t meet a need might give greater consideration to purchasing a car if able. That should terrify agencies far more than an empty bus.
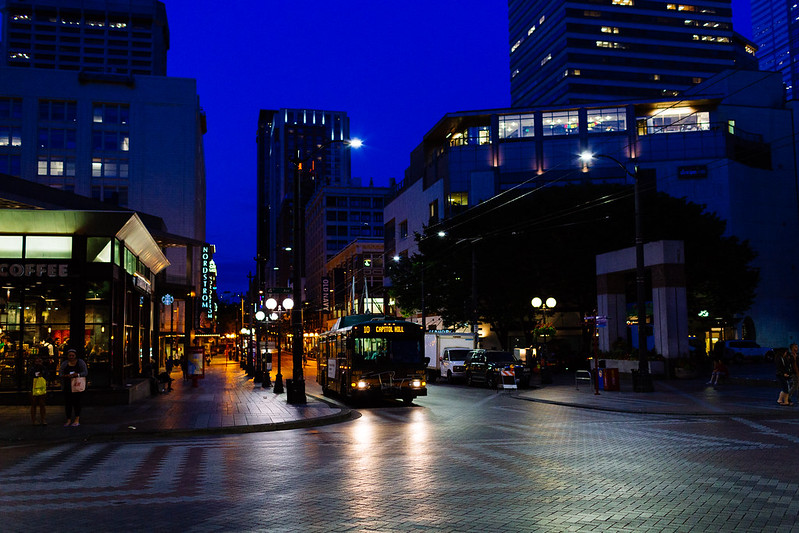
“Omnibus Seattle” by rutlo is licensed under CC BY 2.0.
People who purchase cars out of a legitimate fear that transit won’t meet all of their needs won’t use those cars only when transit completely fails them. Much of the cost of a car is tied to its acquisition, storage, and maintenance; the marginal cost of each additional use is low. The added cars on the road cause transit vehicles to be stuck in traffic, forcing agencies to choose between degraded transit service or making large capital investments in grade-separation, like tunnels or elevated rail. Any decision that a transit agency makes that encourages the purchase of a car is self-defeating; it condemns the agency to running worse service in the long run1.
I don’t think the decision makers at most transit agencies are thinking this way, but their goal must be to make transit the first-choice mode for nearly all trips, and their success should be judged on reducing the rate of private vehicle ownership. There will always be some cases where a personal vehicle allows something that fixed-route transit does not. The idea is to not allow the number of those cases to grow so large that the cost of owning a car seems favorable compared to taking transit for the overwhelming majority of trips, and rarely renting one. Running less frequent service at traditionally low-demand times creates a totally unnecessary additional case where public transit can’t do something. A way to run frequent service, 24 hours per day, seven days per week, while still meeting the budgetary constraints of the present day, should be extremely compelling to Metro.
Other Choices
I didn’t start from scratch when redesigning Seattle’s transit service. I wanted to minimize guessing the time to allocate between stops in the schedule, and King County Metro’s existing transit schedules contain a wealth of information. The vast majority of stop timings in the restructure come directly from Metro’s schedules. The decision to work from that template dictated certain choices.
In the next few years, route restructures around Sound Transit’s light rail expansion and King County Metro’s G Line project will alter transit routes throughout Seattle. As of today, though, the precise schedules that the new routes will follow are not known. Without this information, I’m reluctant to build plans around future transit infrastructure. This dictates that this restructure is based around the transit service of the present day.
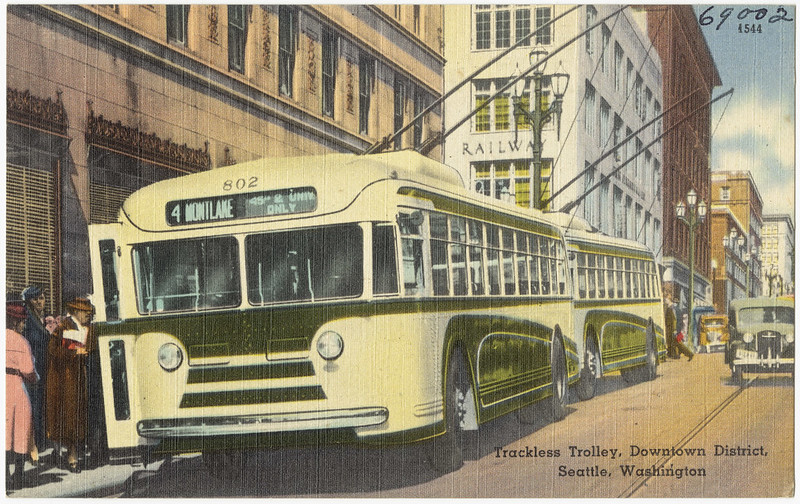
“Trackless trolley, Downtown District, Seattle, Washington” by Boston Public Library is licensed under CC BY 2.0.
I also made limited modifications to routes currently operated by trolley buses. These will not use streets where trolley wire is not already present. I was less strict about terminating trolley routes in places where they would be able to turn back using the overhead wire. Until infrastructure could be modified, it would be necessary to use their battery backup mode for this. This struck me as an appropriate balance of pragmatism and flexibility.
Working from existing schedules also means that there is a large difference in ambiguity between adjusting existing routes and adding entirely new ones. Though there are some streets that could probably support buses, and a transit presence on them would fill gaps in Seattle’s route network, with rare exceptions I refrained from adding transit on new streets. This would have required making a larger number of guesses about the times between stops. Using the existing schedule also meant that I could not make alterations to stop spacing. Given these limitations, I still constructed a network that differs markedly from Metro’s present day one.
Making a Budget
Since King County Metro is reducing service by 3.8%, I sought to design a transit network for Seattle that proportionately reduced the amount of transit service by at least that much. To determine the new upper limit for service hours, I would need to understand how many hours of transit service are run in Seattle. Some routes are entirely within Seattle, some are outside of it, and some have parts both inside and outside the city. In the last case, the duration of the trip is determined by the time between the first and last stops in Seattle. If the trip exits and returns to Seattle, all the time in between is counted towards the service hours. The idea is that service hours used to make any trip within Seattle are counted.
Consider Metro’s route 101, which runs express service between the city of Renton and Seattle. The route makes some stops in Renton, gets on the highway, and then exits in the SODO area of Seattle. From there, it makes stops in SODO on the way to downtown. For the purposes of Seattle’s budget of hours, only the service between SODO and downtown Seattle counts.
Since an access analysis is calculated over a day-long span, the number of in service hours is determined by summing a day’s trips. I treated trips for King County Metro’s bus routes, the Seattle streetcar, and Sound Transit’s light rail and buses2 as being in a common pool. King County Metro employees operate all of these services, regardless of the branding. Since the constraint is a labor shortage, and all the labor is coming from a common workforce, I did not see the need to proportionately cut hours by brand of service.
Since there will no longer be a distinction between weekday and weekend service, I collected the in service time for Seattle on a typical weekday, Saturday, and Sunday. I then determined what the average day would be if the hours were evenly distributed among the days of the week. I reduced this amount by 3.8% to produce a daily service hours budget for Seattle.
| Amount | Seconds | |
|---|---|---|
| Weekday | 5,871 hours, 5 minutes, 27 seconds | 21,135,927 |
| Saturday | 3,861 hours, 20 minutes, 39 seconds | 13,900,839 |
| Sunday | 3,523 hours, 49 minutes, 5 seconds | 12,685,745 |
| Week | 36,740 hours, 36 minutes, 59 seconds | 132,266,219 |
| Average Day | 5,248 hours, 39 minutes, 34 seconds | 18,895,174 |
| Reduction | 3.8% | |
| Target | 5,049 hours, 12 minutes, 37 seconds | 18,177,157 |
Redesigning the Network
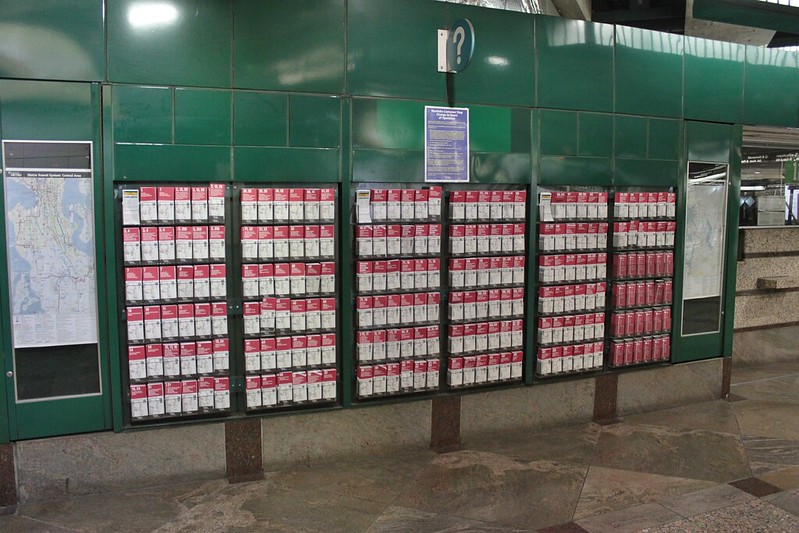
“King County Metro schedules at Westlake Station” by SounderBruce is licensed under CC BY-SA 2.0.
Before redesigning the network, I needed a way to describe the changes that I intended to make to the existing one. I created a general, human- and machine-readable data format for this.
The majority of the file is a list of operations. Most of these specify either a route id, which targets all trips of a route, or a routing id. Routings are a sequence of stops. Every trip is derived of a routing, a variant—which specifies the time deltas between stops, and an offset time—which identifies what time the vehicle arrives at the first stop. Thus, specifying a routing id means targeting any trip that contains a specific sequence of stops. The relationship between routes and routings is many-to-many. Routes can have multiple routings; some routes have shortened service at some times of day, for example. A routing can also be shared across multiple routes. This is rare, but happens with certain runs of King County Metro’s routes 3 and 4, when scheduled between downtown Seattle and Seattle Pacific University. In this restructure, only a single routing for each route is retained3.
All the items in the operations list have an operation parameter, which specifies what to do with the trips that it selects. There are directives to delete a route or routing. The truncate directive eliminates stops at one end of a routing. The extend operation adds a list of stops to a specified end of a routing. The headway directive removes all trips of a routing, replacing them with trips spaced by the specified headway, between provided stop and end times. There is an additional operation that does not pertain to trips: the add stop directive, which allows a new transit stop to be added at a location.
The headway and extend operations pose a problem that the others do not. They create new transit service between stops at times where it hasn’t existed before. The amount of time to progress between those stops needs to be determined. The software uses the trips of the existing schedule to find all the time deltas between adjacent stops. It organizes the deltas for each stop pair by the time of day that the vehicle departs from the first stop. When a route is extended, or a new trip is generated as part of a headway operation, the time between stops can be determined by looking at the deltas for the stop pair, and choosing the one that is closest to the time of day in the new service. The extend operation can create service between stop pairs that previously did not exist. In that case, a constant time between stops is specified using the duration overrides directive. When forced to use this option, I found the scheduled time between stops of similar distance in the area, or if no such option existed, Google’s driving directions. When this varied over the course of the day, I chose the longest duration option. This will overestimate the travel time in low-traffic situations, but solves the problem of missing times.
I described the network restructures for King County Metro and Sound Transit in this format. Then, I applied the data files to the existing schedules for King County Metro and Sound Transit to generate the restructured ones:
| Agency | Existing Network | Restructure Data File | Restructured Network |
|---|---|---|---|
| Metro | Link | Link | Link |
| Sound Transit | Link | Link | Link |
There are a lot of differences between the two networks—too many to discuss each at length—but I want to highlight some salient points. There is no longer any bus service along 3rd Avenue between Pine Street and Jackson Street. While this has traditionally been a bus-focused corridor, I deemed it adequately served by the closely-spaced Link stops under the street. Some buses still cross 3rd to connect to the Link. I also removed all bus service from University Way between Campus Parkway and Ravenna Boulevard. With buses running on adjacent 15th Avenue Northeast, and the nearby Roosevelt Way Northeast and 11th Avenue Northeast couplet, this service seemed better deployed elsewhere. Outside of the U District, 15th Ave Northeast loses its transit service; service on nearby Roosevelt Way Northeast is left to cover it. Apart from these, streets that have had service typically maintain it.
“Trolleybuses on 3rd Avenue” by SounderBruce is licensed under CC BY-SA 2.0.
That is not to say that the nature of that service is unchanged. In general, there is a greater focus on running continuous east-west routes. These allow more points of connection with existing routes that tend to have a north-south orientation. Examples of these are a rethought route 45 running from Crown Hill to Sand Point, and route 60 running from the Fauntleroy Ferry Terminal to Seward Park. In general, there are fewer places where bus routes overlap. When they do, it is often to set up a connection to the Link 1-Line or a higher-speed bus like the Rapid Ride E. Every route4 is changed in at least some small way.
The absence of certain routes in the restructured service should not be interpreted as those routes totally disappearing. Routes that connect the city and suburbs are not being totally canceled at the county-wide level. They were deleted because the service that they provide within Seattle duplicates that of other routes. Route 101 is an example of this. Having an express route from Renton to Seattle makes sense at the county level. At the city level, having an additional route making stops along the SODO busway and through downtown does not contribute much to access. If I were attempting a county-wide restructure, I would limit the amount of time these routes spent in Seattle by having them make the first convenient connection they could to the city’s network. For route 101, I would connect it with the 1-Line at Rainier Beach Station, rather than spending service hours taking an alternate path to downtown Seattle. While the specific way one would reach SODO or downtown would change, the reallocation would allow people arriving from the suburbs to reach a broader variety of destinations within the city, instead of focusing all suburban service on reaching downtown.
I’m not completely satisfied with this network. For the service to fit within the budget, all routes run every 15 minutes. While this meets Metro’s definition of frequent service, to me it is just barely sufficient. It is an upgrade on many routes, particularly outside of the conventional peak periods, but it still makes transferring arduous in the worst case. It also represents a frequency downgrade on routes like the 1-Line, E Line, 36, and 7. The latter two are already slated to receive frequency reductions under Metro’s plan, but a cut to 15-minute frequencies would be more severe. In spite of these concerns, I wanted to see how the network holds up under a more objective measurement.
Evaluating the Network
| Network | 30-Minute Access | Service Hours | Access Map |
|---|---|---|---|
| Existing (Weekday) | 0.1001 | 5871 hours, 5 minutes, 27 seconds | Link |
| Restructured (All Days) | 0.1135 | 4596 hours, 6 minutes, 15 seconds | Link |
| Comparison | ↑ 0.0134 (13.4%) | ↓ 1274 hours, 59 minutes, 12 seconds (21.7%) | Link |
From an access perspective, the restructured network is a clear winner. Despite reducing the amount of transit service in Seattle by 21.7% compared to normal weekday operations—a far greater proportion than King County Metro is targeting—there is a considerable increase in access. I consider this very important. Access is about measuring how many places people can go and how often. The purpose of a transportation system is to let people get places. The measurement seems aligned with the fundamental goal of the system. On the whole, people should have a better experience making their way around Seattle using this restructured network, even though there is less transit service.
Nevertheless, the comparative access map shows some areas of concern. Access to downtown Seattle is much lower. Not only have the 3rd Avenue buses been redirected elsewhere, but the 1-Line is less frequent for most of the day. Downtown is hardly unreachable, though; the most-reduced sectors downtown are still well over one standard deviation better than the average of the city. In this case, the access reduction is secondary to another concern. While I have not broadly considered the capacity implications of the frequency changes in this restructure5, I do worry that the 1-Line through downtown could become overcrowded. Many routes have been redesigned to feed into Link stations, but fewer Link 1-Line trains are running to move these connecting riders.
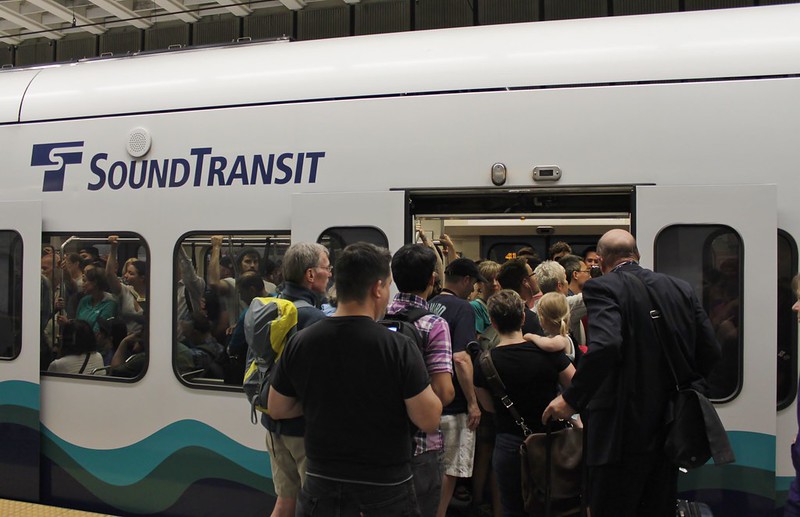
“Crowded Link train at rush hour” by SounderBruce is licensed under CC BY-SA 2.0.
The International District area also shows reduced access. This can be explained by the elimination of bus service on South Jackson Street between 5th Avenue South and 12th Avenue South, leaving only the First Hill Streetcar. While the large amount of existing bus service struck me as hitting the point of diminishing returns, reducing it to 15 minute service looks to have caused a noticeable access penalty. It remains above average for the city, but is diminished.
The paths of the new network’s E Line and route 7 have some noteworthy properties. The southern end of the E Line, and the northern portion of route 7, show a reduction in access versus the existing network. This is unsurprising given that the frequency of the routes has been reduced. Further along the routes, there is an improvement in access, in spite of the frequency reduction. I suspect this is due to the improvements made to routes in the surrounding areas. In the Rainier Valley, east-west routes that cross route 7 are more frequent and continuous. In the northwest part of the city, more routes are designed to feed into the E Line, and routes along nearby parallel streets are more frequent. It demonstrates that access is not just a matter of route frequency, the interplay between routes makes a difference.
In spite of there being some areas of decreased access, the map is dominated by increases. For people originating from many places in Seattle, this transit network will allow them to get more places more often. Since this improvement comes with a 21.7% reduction in service hours, there is no question that King County Metro would be able to operate it reliably every day. I don’t think it would be wise—or that Metro would want—to actually reduce service investment this much. If frequency is the same across all routes and all times of day, though, there is not much ability to run more service. Bumping all routes just up to 12 minute headways puts this network far over budget. The constraint of homogenous frequency is a difficult one. While having it in place created a transit network with greater access at less investment, it limits the ability to respond to gains and loss of funding and labor availability in a granular way.
Bending The Rules
“SoundTransit Central Link: Policy Board” by orcmid is licensed under CC BY 2.0.
My first instinct in improving the network was to start making more difficult decisions about where to cut service. With shorter, or fewer, routes, the overall frequency of the survivors could be increased. Some transit routes are probably close enough geographically that if one were cut, the nearby routes would provide coverage. I could cut service, and then run and access analysis to assess the damage of each change, bumping up the frequency once I’ve cut enough. While this is something that I’m continuing to work on, I decided it might be worthwhile to try being less principled. I relaxed the constraint that all routes must run at the same frequency. After all, it’s not problematic to add service when there is demand, or if there’s an existing expectation of more frequent service. What’s actually important is that each stop is still scheduled for service at least every 15 minutes, no matter what time or what day.
I decided that I would add back frequency on some routes where the change to consistent 15-minute frequency lessened it. I kept headway consistent throughout the day for a given route. The Link 1-Line received 8-minute frequency all day. This is an upgrade over it’s present condition, and I suspect it is operationally feasible. Sound Transit seems to have enough vehicles to run this arrangement at peak times, so I assume that vehicle availability is not the reason that this level of service is not run all the time. I also increased the frequency of the First Hill Streetcar to every 10 minutes. There should be enough vehicles for this, given that this was the originally mandated peak headway for the project. I also did this for all Rapid Ride routes and route 7. The result was over budget only by a few hours, and offered an even greater access gain.
| Network | 30-Minute Access | Service Hours | Access Map |
|---|---|---|---|
| Existing (Weekday) | 0.1001 | 5871 hours, 5 minutes, 27 seconds | Link |
| Restructured, Heterogeneous Frequency (All days) | 0.1198 | 5054 hours, 43 minutes, 27 seconds | Link |
| Comparison | ↑ 0.0197 (19.7%) | ↓ 816 hours, 22 minutes (13.9%) | Link |
For the purposes of this post, this is the final variant. With the equal-frequency constraint relaxed, there are a multitude of possibilities to try. Instead of moving some routes to 10-minute service, would it be better to move more to 12, or fewer to eight? There is a lot of possibility for experimentation, both in terms of spot increases, like these, or more drastic changes that could permit higher frequency across the board. At the moment, though, this network shows enough promise for me to present it as something that King County Metro must seriously consider.
Looking at the Big Picture
“Metro Map 1982” by Oran Viriyincy is licensed under CC BY-SA 2.0.
On September 2, King County Metro will suspend or reduce frequency on 20 routes in response to a labor shortage. Nothing in this post can or should change that. I won’t be surprised if Metro brings back exactly the service that was cut once more drivers and mechanics are hired and trained. When new capital projects are done, Metro will make changes to its network in the immediate vicinity of the new infrastructure. If the past is a guide, the network’s design will evolve slowly with the ebb and flow of funding and the completion of major projects.
I think there is much to gain by breaking from that tradition—discounting some of the assumptions around the design of transit networks, and starting with new guiding principles, as this post outlines. This will come at an initial cost; I suspect no part of Metro’s day to day operation would be unchanged. I’ve observed, just by listening to Metro’s radio calls, that so much of the agency’s staffing and operational practices are based around scaling service up and down throughout the day, and concentrating service in downtown Seattle. With no bus service through downtown, and no notion of peak periods, these practices would cease to be meaningful. I don’t think that’s necessarily a bad thing. There will be less deadheading, since “tripper” buses, which only go out for a limited time to augment frequency, will no longer be required. No driver will have to work a split shift based around being needed only at peak times. These could generate cost savings that aren’t measured by just looking at in-service hours. That aside, the mere fact that it can create a transit network with considerably better access, even while reducing service investment, I assert would make this shift worthwhile.
Aside from the quantifiable—and significant—positive change in access, qualitatively this is a network that will make more people feel comfortable choosing transit. This is a network for the bartenders whose bar closes at 2 AM, and still have cleaning ahead of them. It is for anyone who needed to take an early flight to save money, and then lost that savings when transit failed them at that hour. It’s for people who wanted a fun evening out, but transit could not get them home. It’s for all the people that the current network disrespects the time of, only because their essential jobs don’t conform to “normal commute patterns”. This network redesign makes it easier to eschew vehicle ownership and choose transit. That is a choice that will pay sustaining dividends for a transit agency. Today, this is just a demonstration; I hope King County Metro can take the subsequent steps to make it more than that.
-
While this argument is framed around car ownership, it also applies to using ride hailing apps. A ride hailing company that could only operate at times and in places where there isn’t sufficiently convenient transit would be even less profitable than these companies are today. Therefore, a ride hailing company is going to be active even while adequate transit is available, increasing congestion and diminishing transit performance. ↩︎
-
I only counted the service hours of Sound Transit bus routes that are operated by King County Metro. Sound Transit buses are operated by one of three transit agencies. I am not including Pierce Transit- and Community Transit-operated routes, even though it’s possible to make some trips within Seattle using them. They would not change the budget very much, and since they’re not operated by King County Metro, aren’t particularly relevant in this post. ↩︎
-
This is because the level of service is the same all day. In reality, some of the shorter routings exist so that vehicles can return to a garage if they are heading in that direction mid-route, rather than making longer deadheads from the route’s ends. Because this analysis depends only on when vehicles are in service, considering when vehicles return to the garage is not necessary. ↩︎
-
This excludes the King County Water Taxi due to the inability to exchange staff and vehicles between it and other modes. ↩︎
-
My preference is that agencies consider solutions other than frequency as the primary means of capacity adjustment. King County Metro already does this by having a fleet of different-sized buses. My experiences with Sound Transit’s and Metro’s vehicles, though, is that they fail to make the most of their capacity by having more seats than the vehicles of other transit agencies. While some passengers need seats, many do not. Center-facing, lateral seating that can fold up can allow vehicle capacity to adjust to demand with more granularity. ↩︎