Certain terms used in these posts have meanings that are more constrained than their conventional usage. To avoid ambiguity, they are defined and explained here.
Access
Broadly, access is the ability of people to reach destinations. It is a combined property of some land area, its natural and built environment, and the systems operated in that environment, like public transit networks. In these posts, access is, specifically, the ability of individuals to reach whatever destinations that they desire, wherever they’re starting, and whenever they want to be there.
Access in transit planning literature commonly refers to access to a specific, countable resource, often jobs. This measurement is typically framed as how many jobs the average person can reach, from home, within a time budget. Measuring the ability to reach any particular resource, or collection of resources, only from one’s dwelling, is, in my view, inappropriately specific for the general evaluation of transit networks. Unless stated otherwise, these posts measure unweighted access, where all origins, destinations, and times of day are equally important. The presence of infrastructure to access a place is the signal of its importance. Thus, in unweighted measurements, the countable resource is a unit of land area and time span.
Network access measurement refers to a specific, unweighted calculation. For a given time budget, an isochrone is computed for every sector of an area at every time indicated by a time span and sampling rate. These computations produce the number of completed journeys. The ratio between the completed journeys and potential journeys yields the measurement. The necessity of a specific time budget lends itself to constructions like “the 30-minute access measurement” when a 30-minute budget is used. A sector access measurement is the same calculation, but the isochrones are computed only for one sector. When no qualifier is present, access measurement typically refers to the network-wide version.
An access map shows the overall access measurement broken down by sector. A color scale is used to indicate the relative access scores of sectors.
Access is sometimes called accessibility, but this can be confused with the usability of a transportation system for those with disabilities. I previously used the term spontaneous accessibility for the full-day, unweighted access measurement underlying many of these posts. I found that this led to the incorrect assumption that the measurement was specifically irrelevant to planned trips.
Isochrone (Map)
An isochrone is a description, often visual, of areas that can be reached, with some combination of transportation modes, given a starting point, starting time, and time budget.
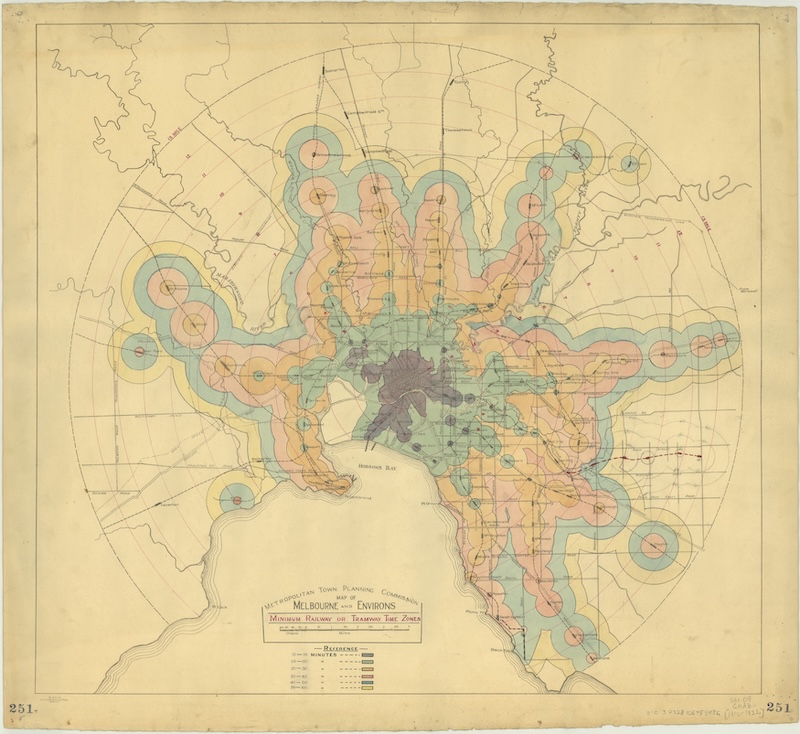
Map from 1910 showing multiple rail network isochrones from an origin point in Melbourne, Australia. Unlike the access maps in these posts, color is used to show multiple time budgets on a single map, rather than the composition of same-budget isochrones computed throughout the day.
Journey
A journey is a combination of origin sector, destination sector, and a starting time of day. A journey is completed if it is possible to start within the origin sector at the starting time, and reach the destination sector within a given time budget, using whatever means of transportation are allowed in the access measurement. The total number of journeys that are theoretically possible given an area, sampling rate, and time span is referred to as the count of potential journeys.
Score
The term score refers to various transformations of the count of completed journeys:
- Most often, the score pertains to a specific sector:
- The composite score of a sector is the total number of completed journeys that originate from that sector (outbound count) multiplied by the number of completed journeys where this sector is a destination (inbound count).
- The mean score is the square root of the composite score, which is the geometric mean of the inbound and outbound counts.
- The composite score ratio and mean score ratio are the above measurements divided by the highest potential value of the score for a single sector.
- Analogous terms describe the entire area. These are useful for comparing a sector against the area on the whole.
- The composite score is the square of the total number of completed journeys, since the inbound count and outbound count are the same, when considering the whole area.
- The term mean score is typically not used in the context of a whole area, since it is just the number of completed journeys.
- The composite score ratio and mean score ratio are the above measurements divided by the highest potential value of the score for the entire area.
These shouldn’t be confused with a z-score, which is a general statistical property of data. In these posts, z-scores are used to describe sectors’ scores in relation to those of all sectors of an area.
Sector
A sector is a uniform division of a land area. Sectors are produced by projecting a grid over the boundary of a space, like a city, county, or any other division. Any sector that does not have a publicly accessible road or path within it is eliminated. A typical sector size is a 80 by 80 meter square, roughly corresponding to the distance covered in a minute of walking. Using uniform sectors, rather than preexisting divisions like census blocks or traffic analysis zones, reduces the modifiable areal unit problem.
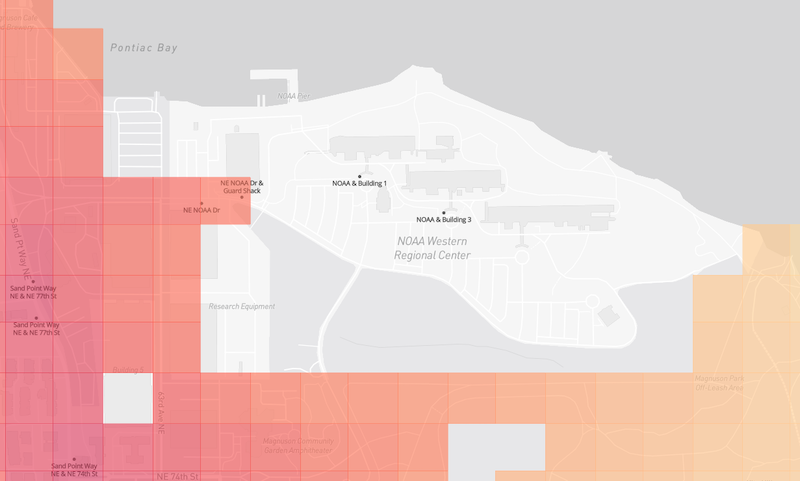
Sectors in Seattle. Note the lack of sectors over water and over the private roads in the NOAA Western Regional Center. Map data © Mapbox © OpenStreetMap
Time Budget
The amount of time beyond which a trip is considered infeasible to make is the time budget. Sometimes this is called the maximum duration. A 30-minute time budget is often seen in the literature because of Marchetti’s constant. These analyses have used budgets between five minutes and two hours.
Time Span and Sampling Rate
Access measurements can be computed for a single time, but they become more representative of the experience of transit riders when the measurement is over a time span within a day, or even over several days. The sampling rate indicates the duration between the individual times in the span.
In these posts, the full 24-hour day time span and a one minute sampling rate are the typical parameters. With these parameters, the access measurement is a composite of calculations made for 1440 times of day.