“King County Metro Rapid Ride New Flyer DE60LFR 6085” by S.S. Sol Duc is licensed under CC BY-SA 3.0.
I recently received feedback critical of the Seattle transit network restructure that I previously proposed. It raised concerns about overcrowding during peak travel times—those associated with the commutes for a traditional 9 to 5 office job. My restructure provides uniform frequency on each route throughout the day. Presently, King County Metro and Sound Transit run extra trips beyond the normal frequencies on some routes during these times. In theory, riders distribute themselves among the additional trips, increasing the capacity of the system at the heaviest-traveled times.
I understand this point, but still think it should be questioned. Even with additional trips, a lot of people could still want to travel at the same time, resulting in a crowded bus, followed by a nearly-empty one. Even in that scenario, though, it’s nice that people who can’t or choose not to board the packed bus don’t have to wait as long until the next one comes. I also feel that Seattle’s local transit agencies don’t approach the crowding problem with mechanisms beyond frequency. Different vehicle layouts and passenger arrangement staff can better utilize limited space. Nevertheless, I must acknowledge that there is a physical limit to how many people can fit in a single vehicle. In my proposal, I tried to account for this by giving the Link 1-Line 8-minute frequency and select other routes, including Rapid Rides, 10-minute frequency, on account of their popularity.
The feedback that I received implied that this was insufficient, which was surprising. On King County’s system maps, most bus lines are marked in one of four ways: RapidRide, frequent all-day, all-day, and peak-only. Frequent all-day routes are described as coming every 15 minutes or less until at least 6 PM (and no mention is made of when the 15-minute service needs to start). For the bus routes under this heading, I figured it was reasonable to expect something like 15-minute frequencies through most of the day. Additional peak service buses—trippers in the parlance of transit—would be fairly rare and scattershot—a few extra trips at the busiest times. Given the feedback that I received I had to question this; I needed a way to comprehend the frequencies of transit routes throughout the day, en masse.
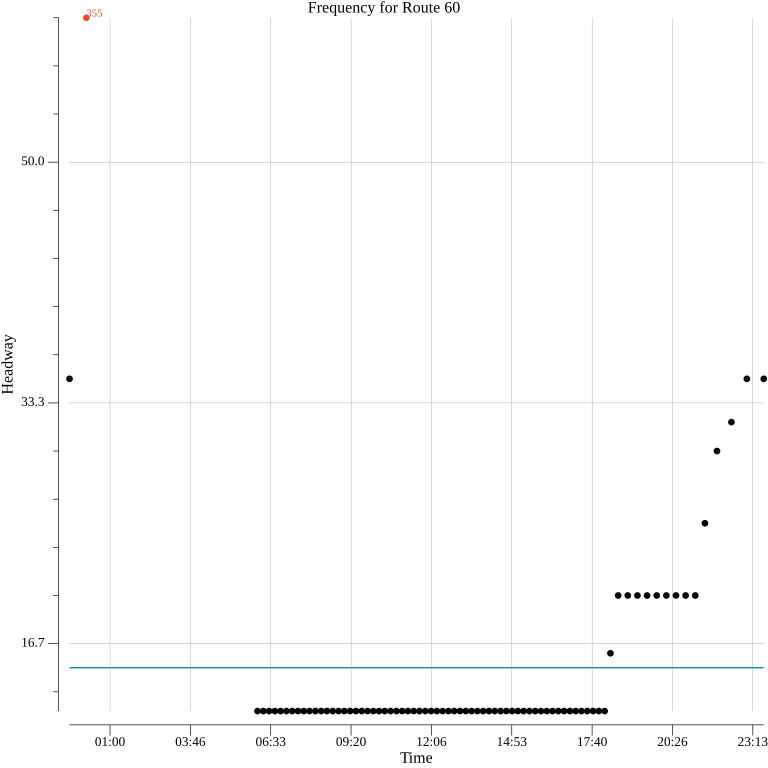
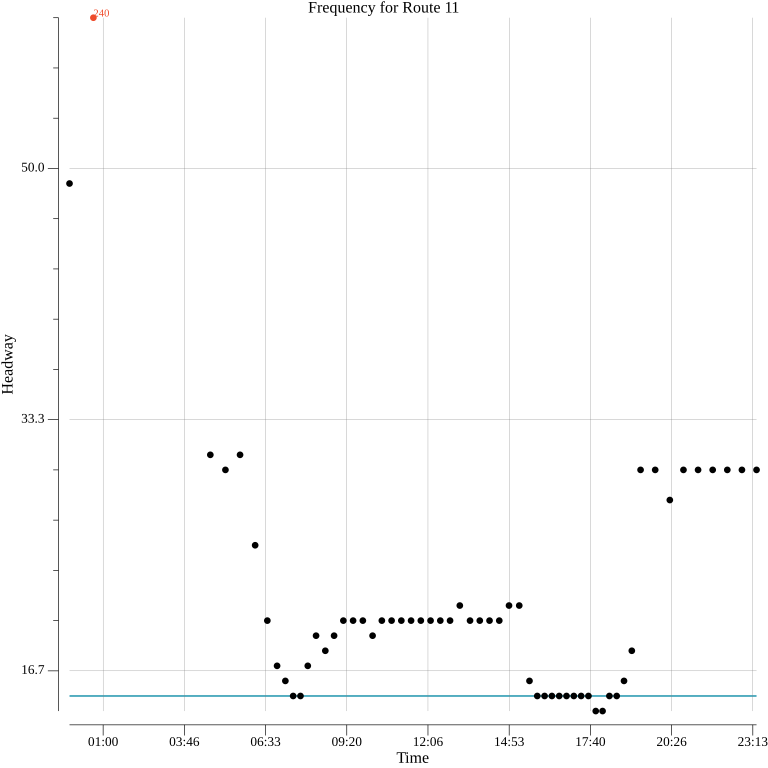
Looking at a bunch of schedules struck me as unpleasant to parse. Instead, I have constructed a scatter plot for each route, with the time of day of the trip on the horizontal and the time to the next trip on the vertical. There is some redundant information in this presentation. It would be possible to look at the horizontal space between dots to estimate the frequency, but using the vertical space makes it easier to compare the variation throughout the day. To preserve a reasonable scale, when the time between trips was greater than an hour, I marked a red dot at the 60-minute line and annotated it with the actual number of minutes.
There is also some complication in determining what is the actual frequency of a route. In a commute-oriented transit network, routes can have different frequencies in each direction, depending on the time of day. I arbitrarily chose the “0” direction in Metro’s GTFS files1. Also, a given transit route might not be the same across all trips, even if all of the trips are given the same number. There may be occasional truncated or extended variants. In the case that there are variants, I found a stop that is common among all the trips, and occurs only one time within a trip. I calculated the time between departures at that stop from trip to trip. This means that the plot is of the best-case frequency; there may be some places along the route where the frequency is not as high. For trips that have only one variant, this devolves to just looking at the departure time of the trip itself.
This post serves as a rough taxonomy of Seattle’s current transit routes. This isn’t a full list of routes operated by Metro and Sound Transit; a route appears here if it covers significant ground, on a distinct corridor within Seattle. The goal is to make it easier to understand how each route will be impacted if frequencies were made consistent throughout the day. The headway under the restructure is shown on the map as a teal line. It’s worth noting, though, that the proposed restructure doesn’t maintain these routes exactly as they are at present. While every restructured route originates from an existing one, it may have been truncated, extended over the path of some other route, or some combination of the two. Nevertheless, these plots still give an idea of what riders along the corridor of the present route are used to, and could expect to happen under the restructure.
Pretty Flat
Some routes already have something resembling uniform frequency. The difference between the present network, and the restructured one, is that existing service universally gets less frequent or stops entirely in the evening. Under the restructure, the same frequency is maintained for the entire 24-hour day.
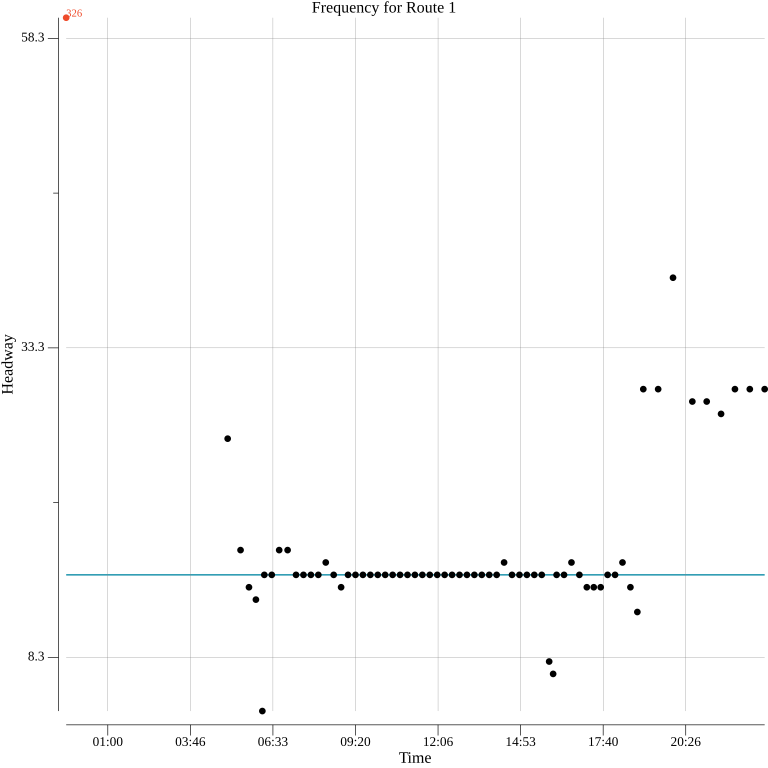
Consider the headway of Route 1. From about 6 AM to 7 PM, the frequency is around 15 minutes; there is no significant change around traditional commute times. When it dips below that, this doesn’t appear to be out of concern for crowding. I looked into the surprising instance of a 4-minute headway that occurs around 6:20 AM. This looks to be the result of an additional bus coming online in order to allow 15-minute headways in the other direction. From a demand perspective, this seems like a wasteful use of resources. There is no way a bus running 4 minutes behind its leader, in the direction opposite the presumed commuter flow, early in the morning is going to be particularly full. This is something that only happens because the current network needs to scale frequency up and down. When frequencies are uniform throughout the day, there only needs to be one-for-one substitution of buses and drivers. This can occur whenever the bus is closest to its depot. There is no need for buses to run token service in one direction so that they can be staged at the end of the line for service in the other one.
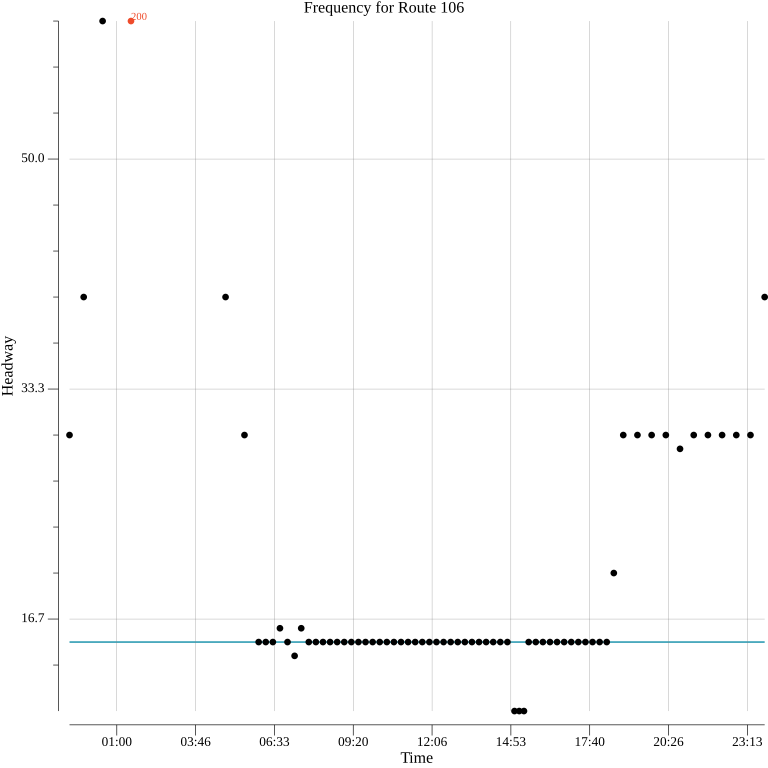
Routes 5, 14, 48, 49, 65, 67, and 124 are similar, with the major difference being the span of 15-minute frequencies. Routes 65 and 67 keep them until 11 PM, while the others end earlier. I’m putting route 106 in this category as well, even though it has a half-hour stretch of 10-minute frequency coming before the traditional evening peak. For riders in these corridors, the restructure means no loss of service during the overwhelming majority of the day.
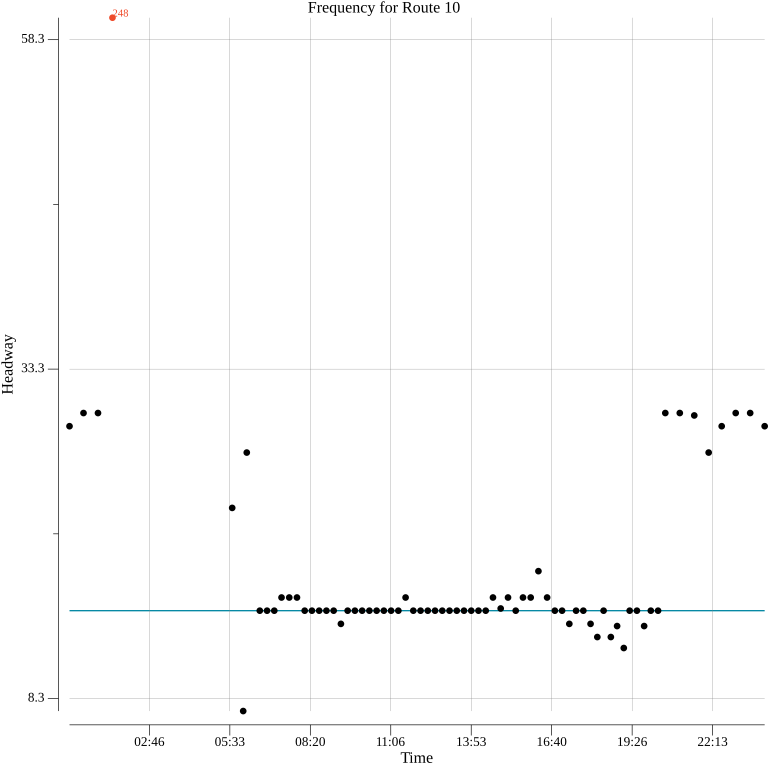
Route 10 is probably in this category too, but it’s hard to tell whether its frequency around the evening peak is an increase or just variation within the schedule.
Route 60 is mostly flat too, but, uniquely, maintains 10-minute headways with no peak augmentation. If Metro’s frequencies are mostly about avoiding crowding, I wonder why it doesn’t regularly use 60-foot buses and run fewer trips on this route. The route has been run with 60-foot buses, but they are rarely assigned to it.
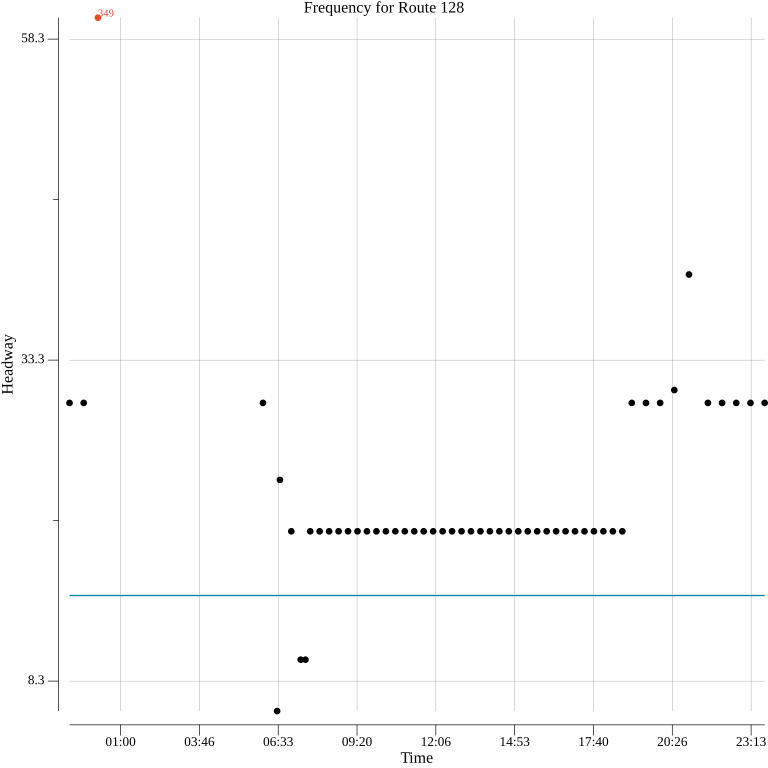
On the other hand, route 128’s headway is mostly flat a 20 minutes during the day. Route 50 is similar.
Peak At or Worse Than Target
Some routes have peaks that just match, or are worse than, the target frequency proposed under the restructure. In most all cases, these corridors will see improved service.
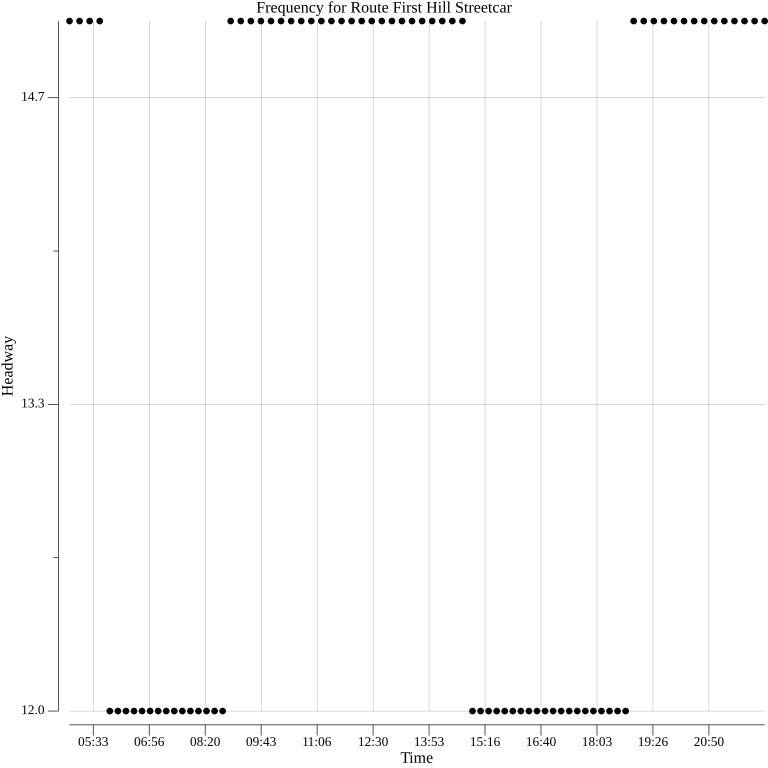
The First Hill streetcar has 12-minute peak headways, making it the most frequent route in this section. It is in this category, though, because it is among the routes proactively given 10-minute frequency under the restructure. This is intended to counter potential crowding from the loss of bus service on South Jackson Street between 4th Avenue South and 12th Avenue South.
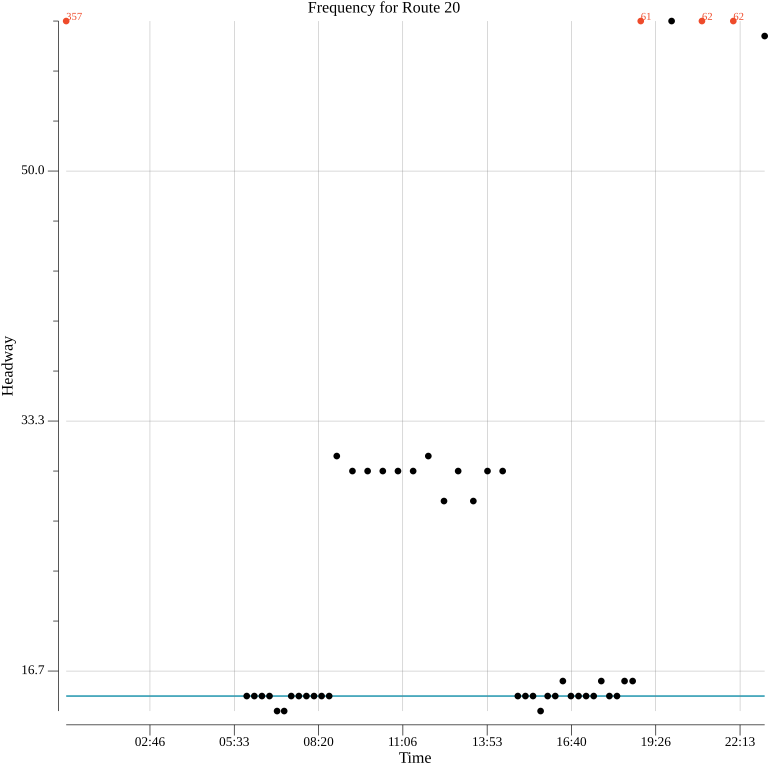
Route 20 has half-hour service midday, hourly service in the evening, and 15-minute service at peak. Routes 24 and 107 are similar. Route 33 follows this pattern mostly, but lacks any evening frequency.
Route 11 has less extreme variation, with 20-minute midday service and 30-minute evening headways.
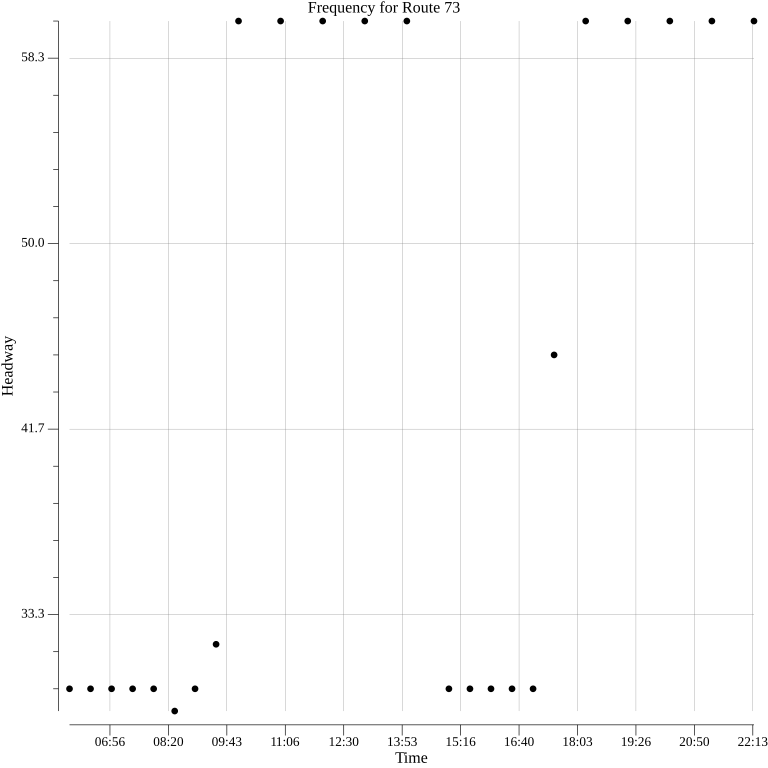
For some routes there is additional service at peak versus midday, but the routes still don’t hit the uniform frequency target. Routes 125 and 128 are like this with 20-minute peak service. Route 73 is similar, except with 30-minute peak headways. It’s worth noting that route 73’s corridor is the exception to the rule of the corridors served by the routes in this category having improved service. Under the restructure, this route is eliminated, because there is service on nearby Roosevelt Way.
Peak Better Than Target
The corridors served by routes in this category currently have peak periods with headways better than their target frequencies under the restructure. They are at greatest risk of experiencing overcrowding under a flat frequency proposal. The E Line is the foremost example of this. During the morning peak, but opposite the presumably heavier direction of travel, it has 10-minute frequencies, which is its target under the restructure. This increases for the midday period, and increases again for evening peak. There are six-minute headways for around a three-hour span. This level of service is exceedingly rare. But if capacity were not an issue, would it be best to allocate this much service to a single corridor and not distribute it more evenly? All that frequency is of no use, even for a person on this corridor, when traveling east or west.
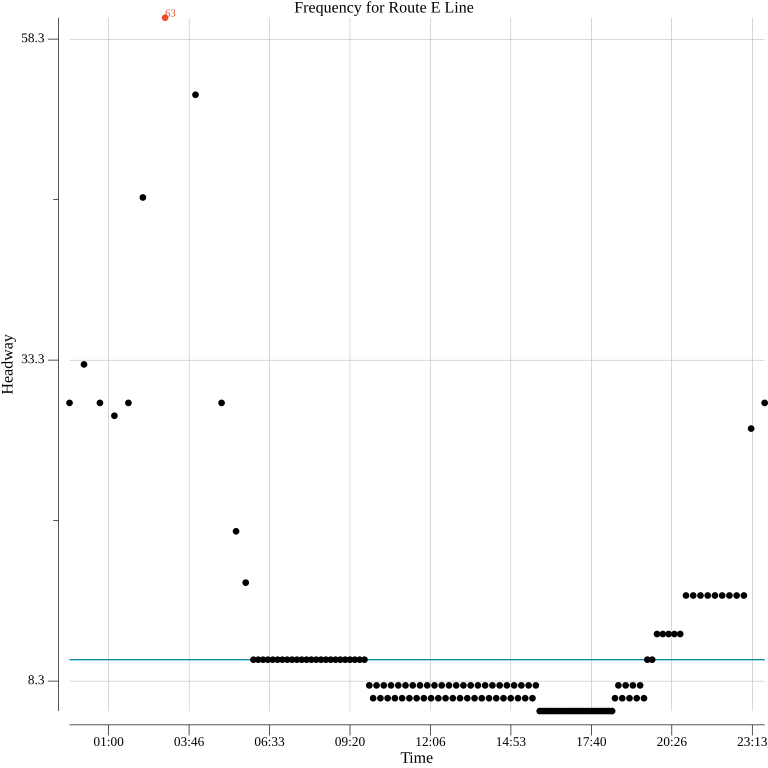
When I see this frequency, on a route that has no truly dedicated right of way, I suspect that there could be diminishing returns. I’ve taken the northbound E Line during its period of six-minute frequencies, and on multiple occasions have waited longer than that. Buses get stuck in traffic and become bunched; often this results in a very full bus followed by an empty one. I didn’t think that 10-minute all-day frequencies were unreasonable because my experience riding the E Line didn’t lead me to believe that its peak headways were that much better.
The E Line’s exceptional headway—one that it has trouble maintaining in practice—reads to me as an admission that Metro’s largest buses are an inadequate tool for serving the corridor. A true solution to this—higher capacity, grade-separated rail service on this corridor—is not coming soon. Given the position that Metro is in, I wonder why Rapid Ride buses, a distinct bus fleet within Metro, are being ordered with nearly the same seat layout as its standard, three-door, 60 foot coaches. What prevents Metro from removing all the seats—aside from a few for elderly, disabled, and pregnant passengers, located in areas unusable for standing, such as over wheel wells—from some of its buses? I don’t know if this would increase capacity enough to reallocate some E Line service without inducing overcrowding, but I don’t see Metro doing the research to figure this out. Frankly, I’m tired of agencies acting like frequency is the only tool they have for managing capacity. Take some buses due for retirement, rip the seats out, and run a pilot!
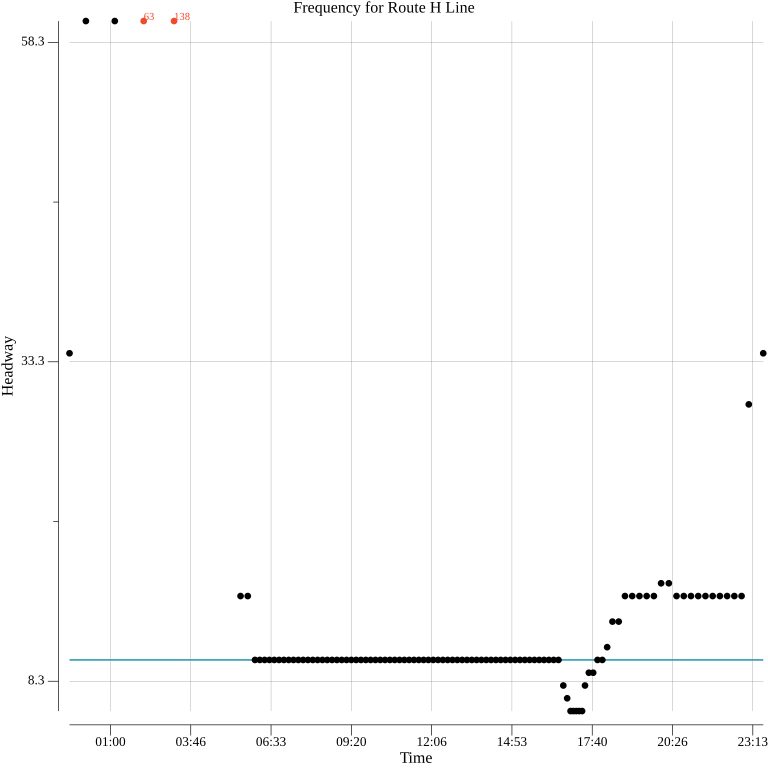
Within the category of Rapid Ride routes, the H Line sees a far less acute loss of service because of its short peak period. The C and D Lines are somewhere in between it and the E Line.
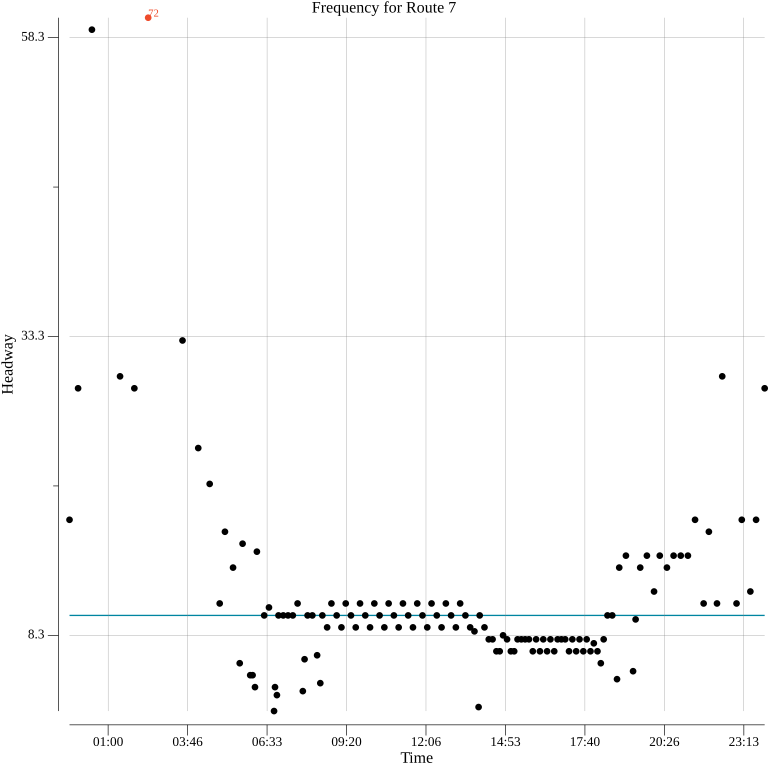
Route 7 has been given the same treatment as the Rapid Ride routes. It has been a candidate for Rapid Ride conversion, and is known to be heavily ridden. It has consistent 7- to 8-minute frequencies at peak, meaning that the uniform target is still a service reduction.
Routes 36 and 44 could have been given this treatment too. Both have midday frequencies better than 15 minutes, and a further increase in service during peak. As such, 15-minute frequency is a considerable downgrade.
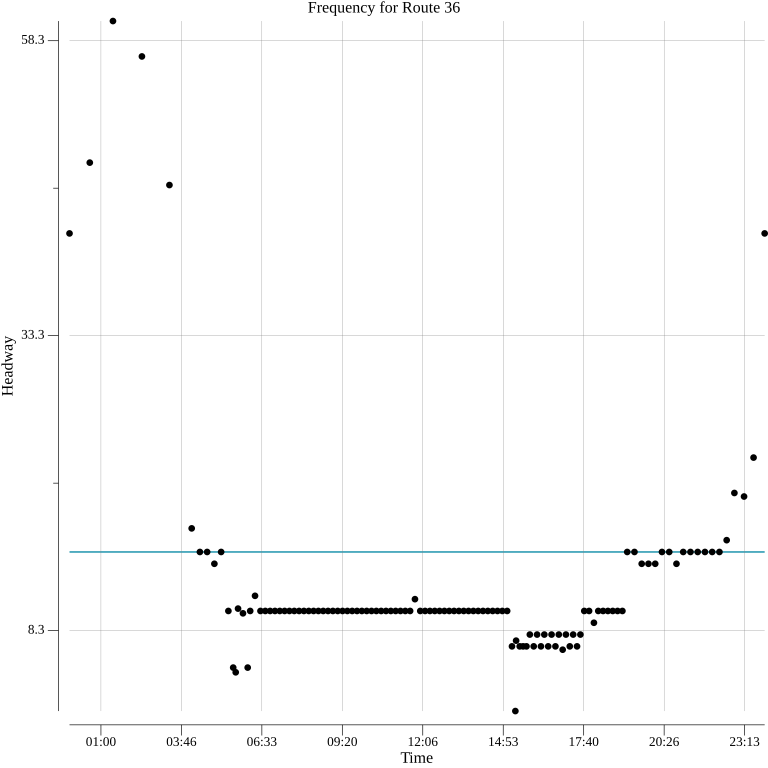
Route 36 is run primarily with 40-foot buses. Occasionally, 60-foot buses are used, but are not a regular feature. As in the case of Route 60, I question why this approach is used. Route 44 is operated with a mix of the two bus types, so there’s less opportunity to control crowding under worse frequency solely by switching to larger vehicles.
Route 8 is a standard fairly example of a “frequent all-day route.” It has 10-minute headways at each of the peak times, 15-minute service midday, and a stepped fade to no service overnight.
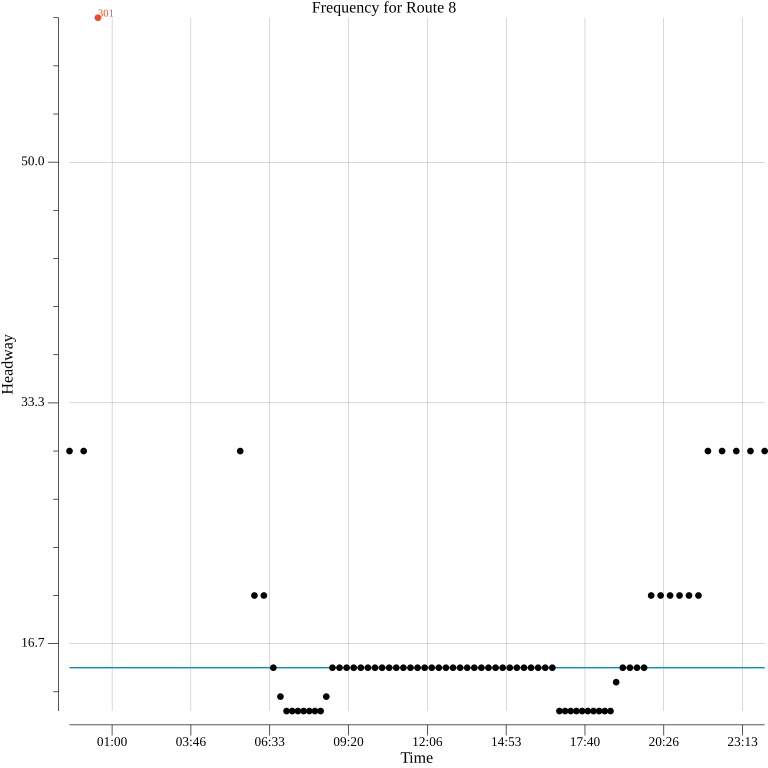
Routes 12, 40, 45, 62, 70, 75, and 372 generally follow this pattern, with some variability around the length of peak service, and when and how gradually the stepping down to evening frequency occurs.
Peak Only
Some Metro routes are only scheduled to run during the peak commuting periods. Some of them are overlaid with other transit routes that run all day. On some corridors, though, they represent the only transit service available.
My approach to the former is generally to delete the service. Having direct service to a different destination only during a specific time of day can be convenient; it can get a person traveling then to a place faster by not having to transfer to another route. When the number of service hours are limited, this should be subordinate to running frequent service on all corridors, in my view. Routes 9 and 43 fall into this category.
The justification behind the latter is that the only time the destinations along these routes can muster adequate demand for fixed-route transit service is during the peak period. This becomes a self-fulfilling prophesy; the areas served by these routes can’t attract non-peak riders if there isn’t non-peak service. I upgraded the portions of these routes that don’t overlap with others to have 15-minute frequencies, 24 hours per day. Routes 56, 57, 113, and 322 received this treatment.
Overlapping
It’s difficult to characterize the frequency of certain routes because, over a significant stretch, the route is paired with another. Those traveling exclusively along the corridor where the two routes converge have higher frequency available to them, but anyone seeking to go beyond the overlap has less, since they must catch a specific route.
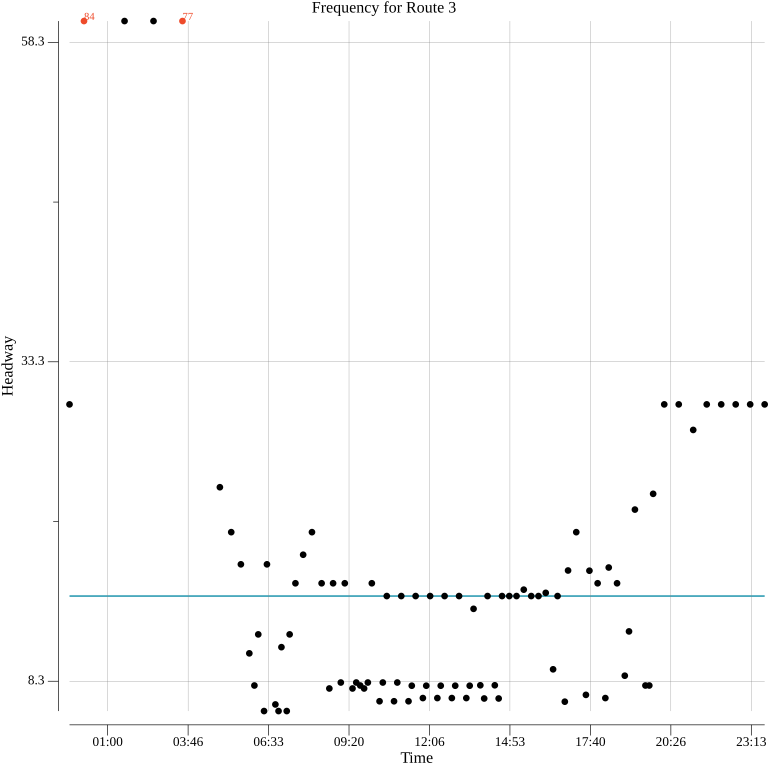
Routes 3 and 4 are an example of how messy this can get. The full extent of Route 4 is from Seattle Pacific University to Judkins Park, with Downtown Seattle and First Hill as intermediate destinations. Route 3 is the same, except the Judkins Park terminal is replaced with one in Madrona. On top of that, there shorter variants. Some, from either direction will only go as far as downtown. Others coming out of downtown will only go as far as First Hill. There are some trips that serve the exact same stops, but some are classified as Route 3 and others Route 4.
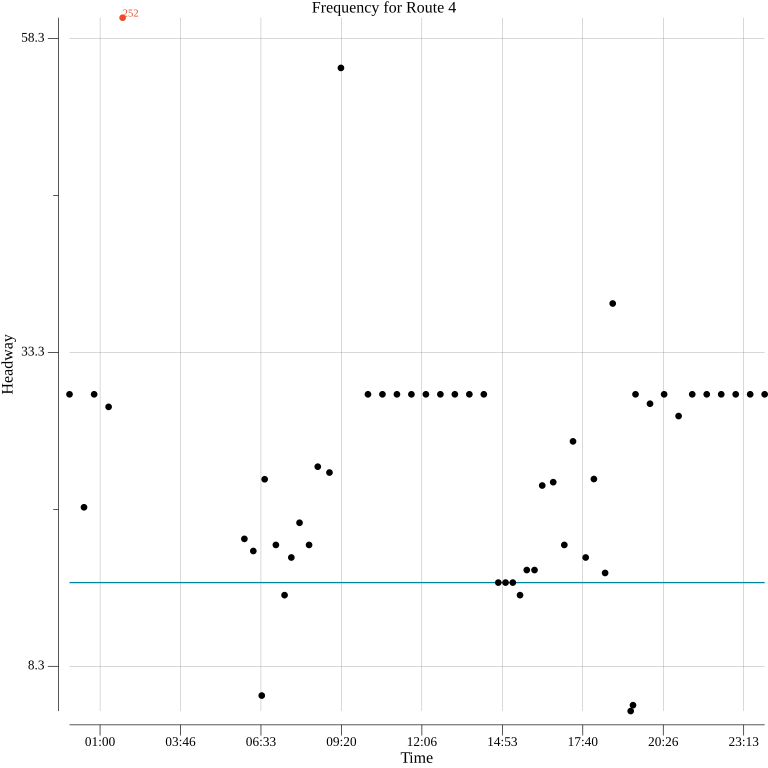
The effective frequencies of Routes 3 and 4 depend on where one is, and where one wants to go, and it takes the combined schedule to make sense of it. From morning until early evening there’s frequency between five and eight minutes on the downtown to First Hill segment. The segment between Seattle Pacific University and Downtown has a 10-minute peak, and the section between First Hill and the terminals has headways peaking at around 15 minutes. Under the restructure, Route 3 covers the segment from downtown to Madrona, and Route 4 goes between Seattle Pacific University and Lower Queen Anne. (The section between First Hill and Judkins park largely overlaps with Routes 48 and 8, and has been eliminated altogether.) Depending on one’s origin and destination, there’s either the same frequency as the current peak available all day, a modest reduction in peak frequency, or an extreme one.
Like some other routes mentioned before, Metro’s need for high frequency on the middle portion of this route seems to partially be a consequence of the equipment used. Routes 3 and 4 are typically run with 40-foot trolleybuses. In the past, some single trips would occasionally be run with a 60-foot conventional hybrid bus. Despite operating 60-foot trolleybuses, Metro never runs them on these routes.
I find Metro’s choices here especially vexing. If the route for some reason2 can’t be operated by the 60-foot trolleybuses, then maintaining trolley service with inappropriately sized equipment doesn’t seem like a sensible decision. If it can, why did Metro order so many 40-foot trolleybuses and so few 60-foot ones? It’s fine to give people going from downtown to First Hill exceptionally frequent service, but—like the case of the E Line—it’s of limited impact. It doesn’t contribute to a system that enables people to meet all their various needs with transit.
Routes 2 and 13 are another example of a pair of routes with an overlapping segment, and shortened variants, making it hard to state a single frequency for the route. Some Route 2 trips coming into downtown become Route 13 trips to Seattle Pacific University, others keep the 2 designation and continue to West Queen Anne. Both routes have a short peak period of frequencies better than 15 minutes.
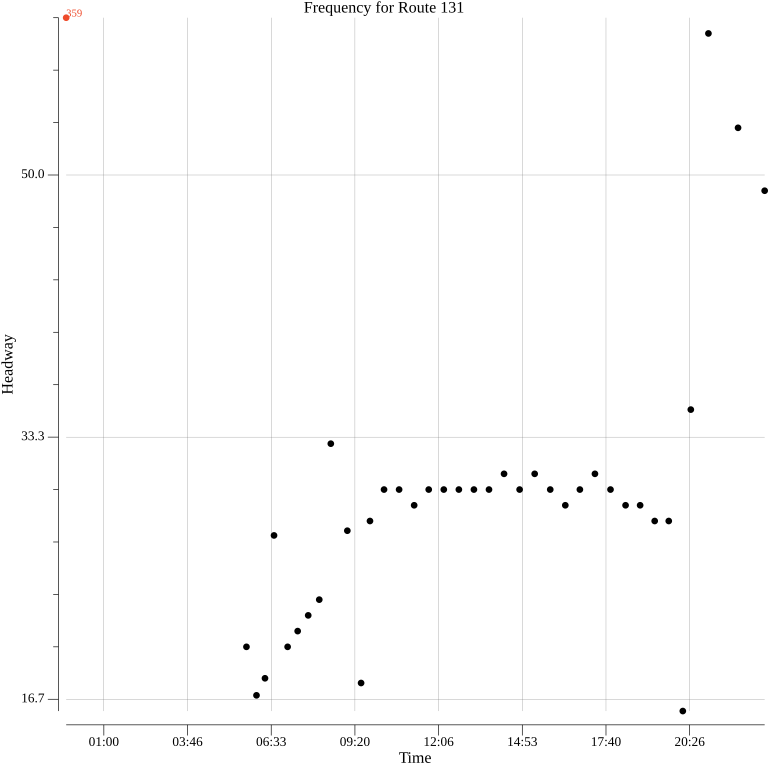
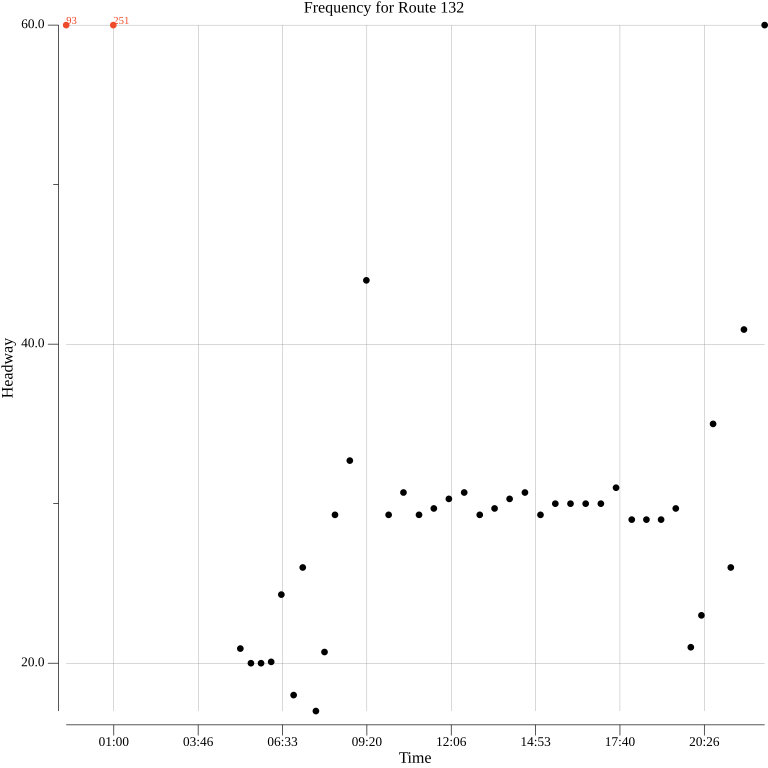
Routes 131 and 132 have 10-minute peak service on their overlap between downtown and Georgetown, and 15-minute headways otherwise. Routes 345 and 346, and Routes 347 and 348, are similar on their respective concurrencies
Just Haphazard
There are a few remaining routes that defied classification, often because their frequencies seemed very erratic.
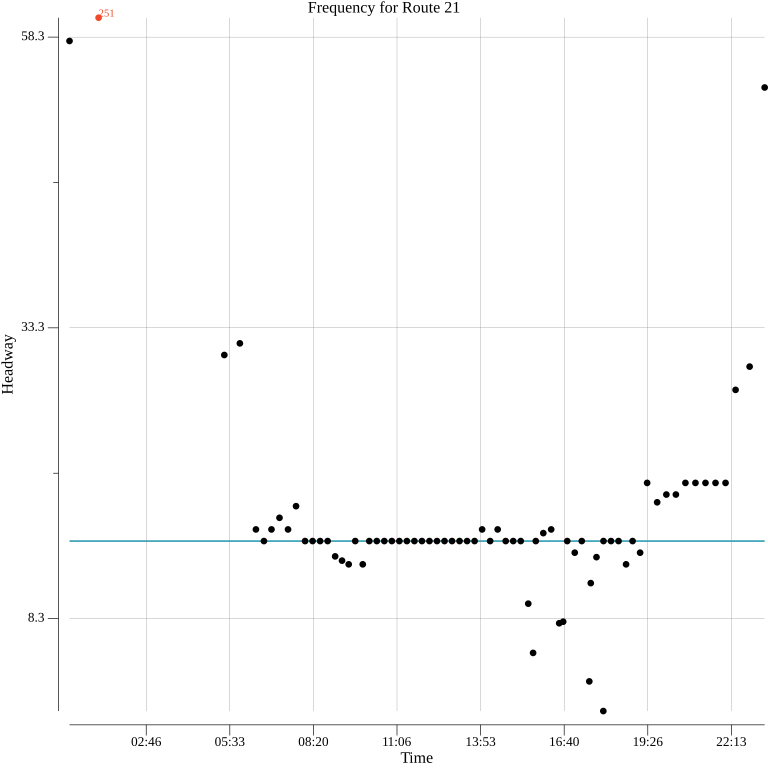
The peak trippers for Route 21 come at inconsistent intervals and within the peak time, there are still some periods of 15-minute headway. Some of this might be trips from the route’s express variant folded into local service that has mostly flat headways.
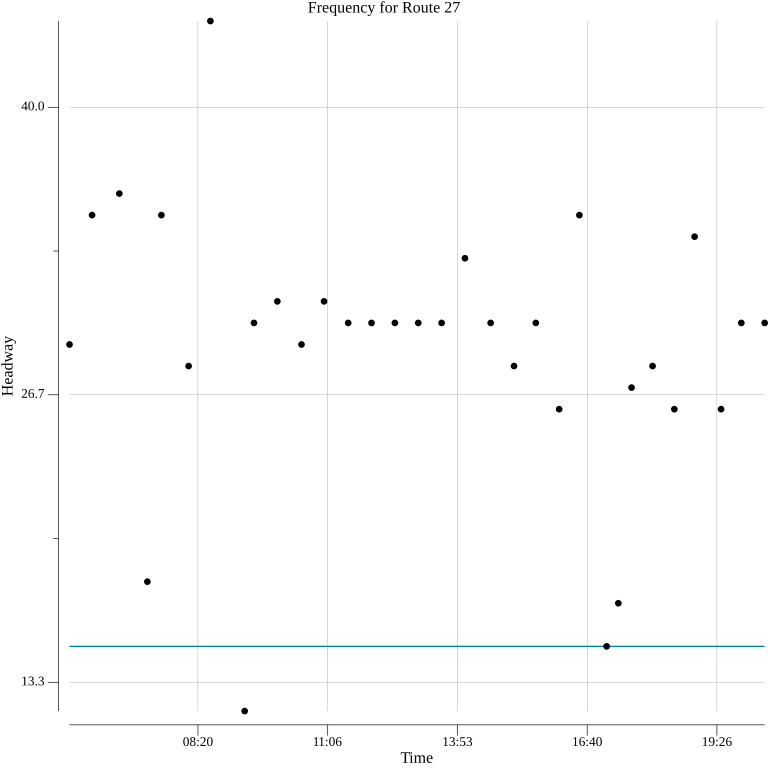
Route 27 looks like it has two peak trips in the 15-minute frequency range, and pretty scattershot headways otherwise.
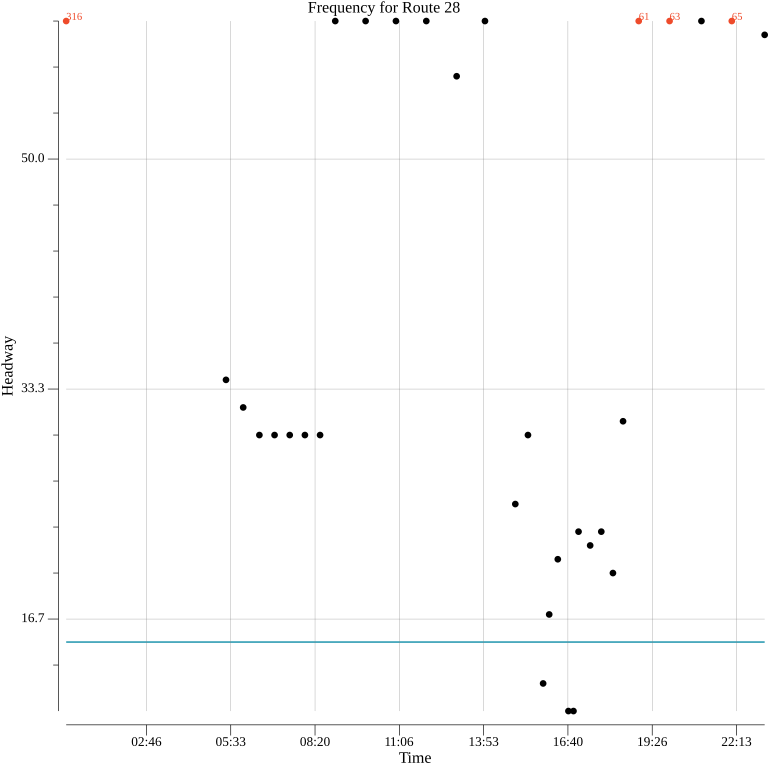
I couldn’t begin to describe what’s going on with Route 28.
“Go Fuck Yourself”
If were I feeling charitable, I’d put the two routes in this classification into the “Pretty Flat” section and make a one-sentence note about their approximately hourly frequency. Instead, I think routes 22 and 79 should be called out explicitly. Hourly transit service has no place in a city. The title of this section is what Metro is telling the people trying to use transit on these corridors.
In spite of the increased resources allocated to them, in some ways routes like these are worse than peak-only service or no service at all. Metro gets to put an “all-day route” line on its map, visually equating them with routes having much more service. If someone using this route has to make a trip to fulfill a time-sensitive need, like a medical appointment, they might need to plan to arrive up to an hour early. Even if the need can be met at a range of times, like grocery shopping, if there is any variability in how long the errand will take, they might be stuck waiting an hour on the trip back. It’s setting up people to fail to have a good experience on transit.
This is the sort of service that gets implemented when a corridor does not see many riders over a period of time. Without demand, the frequency should be reduced, according to the conventional transportation planning wisdom. As a result of the subsequently less convenient service, fewer people can meet their needs by taking transit. This continues until the route is canceled because “no one was riding it.” It’s an insidious pattern that fosters car dependence.
Using This Taxonomy
My primary use of this taxonomy was to get a better understanding of the effect a uniform-frequency restructure could have on King County Metro’s existing transit corridors. More routes than I anticipated, though far from all of them, landed in a category that puts them at risk of overcrowding. When I proposed my restructure, I stated that I wasn’t entirely happy that 15-minute frequencies were the best that could be mustered. Metro’s definition of 15-minute headways as “frequent” convinced me that it was still worth presenting. What Metro’s own taxonomy hides is that many of these routes have substantially better peak headways—and some are better throughout the day—despite looking exactly the same on a map. While I still think that Metro and Sound Transit must look at approaches beyond frequency to maximize capacity, I must acknowledge a distribution of risk that is broader and more acute than I anticipated before this exercise. This spurs me to revisit the restructure, with an eye toward better headways across the board. A sparser route network could be the result, and whether that makes sense from an access perspective remains to be seen.
This taxonomy has also brought to mind a larger question. Even within a category, the frequencies of routes over the course of a day are extremely variable. There do not appear to be obvious, consistent rules that dictate headways. So are Metro’s route frequencies finely tuned instruments for managing capacity, or ossified and incoherent artifacts left behind by planners through the ages? If the former, then a uniform-frequency restructure steamrolls a lot of careful thought on crowding. To be comfortable proposing this restructure depends somewhat on an impression that the latter is true. This is not a condemnation of Metro, just the reality that the organization runs some routes that mirror erstwhile streetcar lines dating from the turn of the last century. Is it reasonable to assume each and every Metro route has frequencies attuned to present ridership, or is it more likely that the frequencies of some routes could be following usage patterns from pre-pandemic times, the 1980s, or the 1890s? Depending on the answer to that, perhaps some of the worry about uniform frequencies causing crowding comes from an excess of reverence for the status quo.
-
The GTFS file format allows the marking of a direction with “0” or “1” and does not specify what each indicator means. This is because some routes don’t have a notion of “inbound” and “outbound”. ↩︎
-
Portions are very steep and I’ve heard unconfirmed information that the 60-foot trolleys cannot safely operate on them. ↩︎