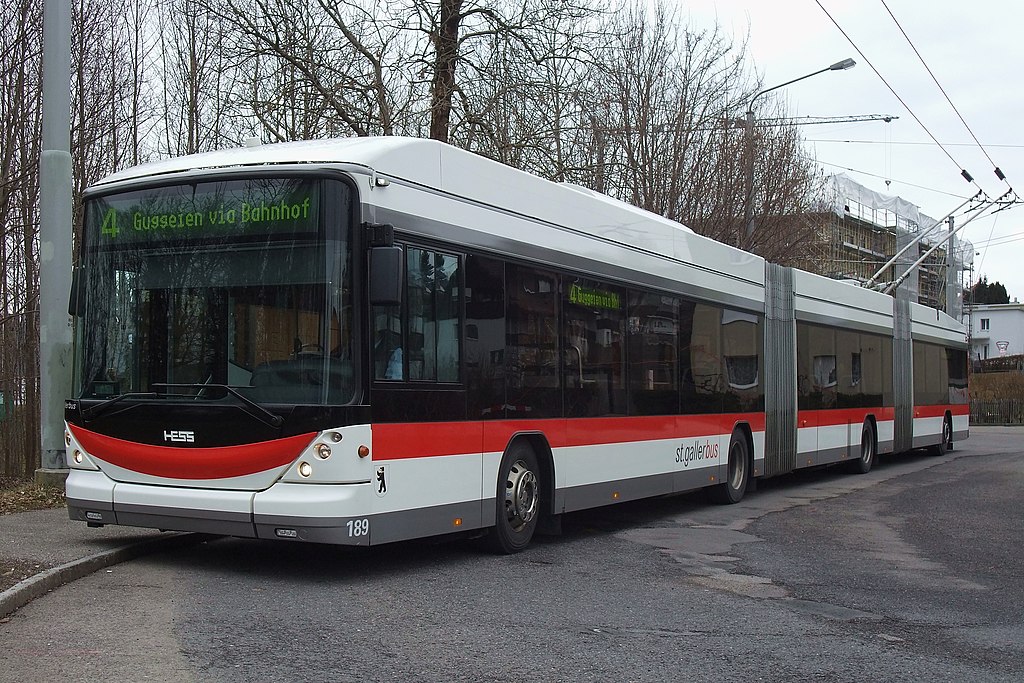
“Double Articulated Trolley Bus” by Kecko is licensed under CC BY 2.0.
When trying to solve a complicated problem, I find it useful to ignore obvious constraints at first. It’s obvious that a transit vehicle cannot hold an infinite number of people. Yet when I proposed a redesign of King County Metro’s transit network in Seattle with frequent, 24 hour, seven day per week service, that is exactly what I did. I find that being confronted with a large number of constraints early on encourages an overly conservative end goal.
Beyond the objective of uniformly frequent service, only one constraint governed my redesign. I did not want the new network to increase the number of person-hours required to operate the system’s transit vehicles. This is the predominant expense of transit agencies. Keeping this net-neutral separates a pragmatic proposal from a fantasy. All other constraints could be sorted out later. Thinking in this way produced a network that doesn’t resemble typical transit service, though a rider could easily see the benefits.
If capacity constraints did not exist, it would be possible to create a substantially more useful transit network in Seattle. That may sound like an absolutely bonkers way to think, because capacity is a real constraint, of course. It’s not feasible to invent an infinite capacity bus. It’s not even pragmatic to say that corridors can be upgraded to higher-capacity rail as buses get crowded. The planning and construction of the Link makes it clear that this infrastructure doesn’t just appear overnight.
The benefit of employing this methodology is that the allure of the end result can change how a constraint is viewed. Uniformly high-frequency service will not work with Metro’s current fleet or crowding standards, but it doesn’t need the mythical infinite-capacity bus either. Striking this balance requires going beyond the facile assertion that the proposal will certainly cause overcrowding. It is necessary to understand where, when, and to what extent crowding occurs. Only then is it possible to select appropriate tools for meeting—or relaxing—the constraints, without losing the vision—or ignoring reality. This is my preliminary work toward understanding whether a uniform-frequency restructure is doomed by overcrowding.
On King County Metro’s Ridership Data
To assess the impact that the restructure would have on crowding, I requested ridership data from King County Metro. I asked for stop-by-stop vehicle loads for every vehicle on a typical day. I quickly received a response that data for individual days was not preserved. Instead, I was offered the average stop-by-stop loads by trip for the Fall 2023 service period.
Only having an average is unfortunate. When considering overcrowding, I would assert that it’s more useful to know something like the 90th percentile vehicle load. A trip can be moderately crowded on average and still have many days on which passengers are refused. My plan was that after building the infrastructure to process one arbitrary day of data, I would request a few more. This would at least allow me to construct a cursory distribution of load. Since it seems that Metro is destructively averaging this data as the service period goes on, I’m forced to gauge crowding from the average. Metro’s System Evaluation indicates that they do the same thing.
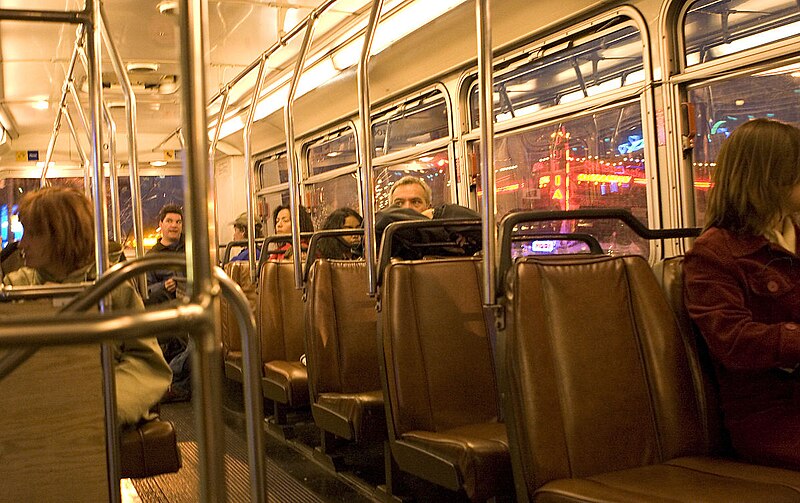
“Bus interior, 2005 (2851696368)” by Seattle Municipal Archives from Seattle, WA is licensed under CC BY 2.0.
On top of this, there are quirks to the ridership data. While I’ll discuss the specific way that I analyzed it in a subsequent section, part of that analysis involved combining it with Metro’s GTFS schedule data. At first, I was perplexed that there were no common trip identifiers between the two datasets. This was corrected by appending a “5” to those in the ridership data. There were also issues with the trip sequence number associated with the loads. Assigning a sequence number to each stop in a trip is a standard practice, since a trip-stop pair does not correspond unambiguously to a single time that a vehicle stops1. Unfortunately, these sequence numbers did not correspond to the sequence numbers in the GTFS schedule. Sometimes, but not always, they were just the ordinal number of the stop within the trip2. Luckily, the ridership data also provided a stop identifier for each row. When there was a mismatch between the schedule’s stop and the ridership data’s stop, I had the program fall back to the first instance of the specified stop in the trip. I don’t know of any looped routes that Metro runs in Seattle, so I suspect this had no impact. On top of that, some trips had “NULL” instead of a sequence number. These trips were skipped; fortunately none of them are in Seattle. Using the data was frustrating, but I think I was able to draw accurate enough conclusions.
With no record of when passengers were refused, even flawless vehicle load measurements would systematically undercount demand. Nevertheless, this is the information that is available for making decisions about overcrowding. I’m not happy about having to look past its flaws, but if it’s good enough for Metro, it will have to be good enough for me.
Defining Crowding
King County Metro defines crowding in a specific way, and it influences the character of its transit service. Reducing crowding is Metro’s first priority for investment. According to Metro’s System Evaluation document, crowding is when:
- The vehicle’s average maximum load is more than the crowding threshold for the type of vehicle.
- The average passenger load is more than the number of seats for 20 or more minutes.
The “crowding threshold” is determined in this way:
Each coach type Metro operates has its own crowding threshold, which is determined by adding the number of seats on the coach to the number of standing passengers the coach can accommodate if each passenger has at least 4 square feet of floor space.
I appreciate what Metro is trying to do, but there is a clear downside to it. Riding sitting down is more pleasant than standing. Crush loads are uncomfortable, potentially dangerous, and hinder reliable operations. It’s reasonable to want to avoid these, but at what cost? Metro’s crowding standards are standing in the way of providing frequent, 24/7 service. This is a tradeoff, and I think that Metro is making the wrong choice. I propose renegotiating the crowding standards, given how impactful the restructured network would be.
In my assessment of crowding, I’m not prioritizing the avoidance of standing. Some passengers medically need to sit, but many do not. In modern transit vehicles, some amount of seating will always make sense, since the wheel wells are wasted space unless seating can be placed atop them. Additionally, seats that flip up—already used in Metro buses’ wheelchair securement areas—can balance offering seating when absolutely needed, and allowing greater density in existing vehicles otherwise. More people would be standing on average—the expectation would be to anticipate standing at peak times unless medically unable—and I find that perfectly reasonable. In the overwhelming majority of cases, the desire to sit is a lesser need than the desire to reach one’s destination in a timely fashion regardless of the time of day. I have no misgivings about asking many people to stand during their commute so that one person can get home at night without waiting for hours. The level of sacrifice is entirely different.
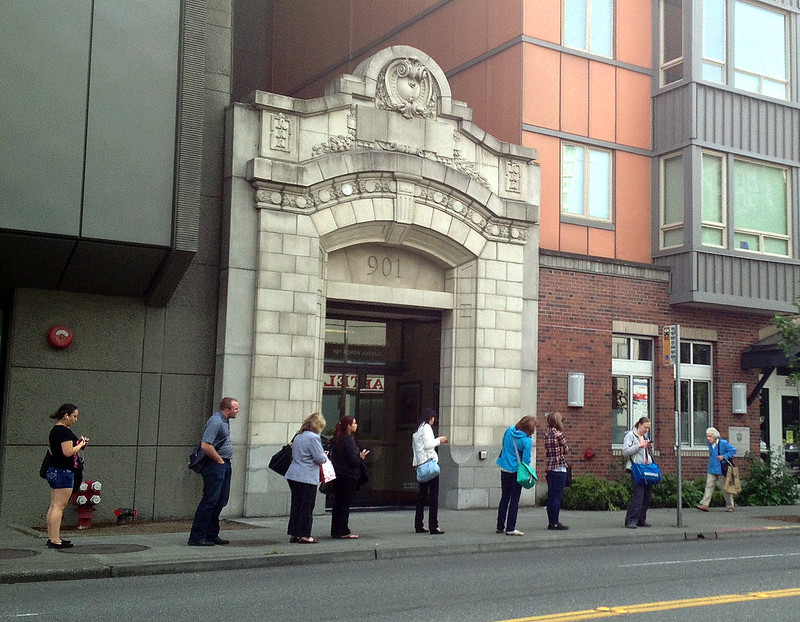
“Personal Space, Seattle Edition” by JoeInSouthernCA is licensed under CC BY-ND 2.0.
I can’t find floor space figures for any of Metro’s vehicles, so reasoning about a capacity target—either Metro’s present one or a hypothetical one—is somewhat challenging. A Seattle Times article reports that Metro’s capacity for a 60-foot bus is 83 people. Assuming that this is given 4 square feet per person for standees, some cursory research suggests that it could be increased. This is 2.7 passengers per square meter, with six still being considered below crush loads. Also supporting this is that New Flyer Excelsiors, which make up much of Metro’s 60-foot bus fleet, have a capacity of 61 seated passengers and 62 standees, according to their specification sheet. I contacted New Flyer concerning the hypothetical capacity of a configuration with minimal seating, but did not receive a reply.
I decided to investigate all cases where the restructured service would have an average load that exceeds 120 passengers. I suspect this may seem high. If the average load is just under the manufacturer’s stated capacity, any deviation above it would seem to cause overcrowding. I’m counting on additional capacity being opened up when seating is removed. I would expect the conversion factor between seated capacity and standing capacity would be somewhere between 1.25 and 1.75 times, yielding a theoretical total between 138 and 170. All this being said, targeting a load of 120 is a guess, but no other guess is necessarily better. It’s just not possible to make an informed statement about high-percentile values using only the average.
Measuring Load for a Transit Network That Doesn’t Exist
I used a relatively simple approach to make preliminary guesses about vehicle load under the proposed restructure. I’m largely assuming that the amount of passenger load passing through a stop will not change, even though modifications to the network could cause riders to take new paths to their destinations. Predicting shifts in load is complicated and error prone. In a few cases I’ve speculated how load may change, but I’m not doing anything systematic.
For each stop, I collected all trips’ average loads observed there, and used Metro’s GTFS schedules to associate a time. This allowed me to assign each load to a time-based “window”. The baseline level of service under the restructure is 15-minute frequency, so the day gets divided into 96 15-minute windows. I summed the stop-loads in each window to produce an expected total load through the stop under the proposal. Since some routes have eight- or ten-minute headways under the restructure, I repeated this process with windows of these durations. For stops that are currently served by many routes, or ones that have high peak frequencies, this process approximates being served instead by a single route that runs at a consistent headway. This reveals potential problem spots where load seems to be reaching or exceeding the capacity of Metro’s largest vehicles.
| Stop | Stop Name | Highest Load | Window Start | Window End |
|---|---|---|---|---|
| 605 | 3rd Ave & Bell St NB | 325.2 |
17:00 | 17:15 |
| 600 | 3rd Ave & Virginia St NB | 258.9 |
16:30 | 16:45 |
| 400 | 3rd Ave & Bell St SB | 239.8 |
8:00 | 8:15 |
| 468 | 3rd Ave & Seneca St SB | 234.8 |
17:00 | 17:15 |
| 575 | 3rd Ave & Pike St NB | 219.5 |
17:15 | 17:30 |
| 1562 | Alaskan Way S & S Jackson St SB | 210.4 |
17:15 | 17:30 |
| 1561 | Alaskan Way S & S Jackson St NB | 205.1 |
8:15 | 8:30 |
| 1559 | Alaskan Way & Columbia St SB | 204.1 |
8:00 | 8:15 |
| 1480 | S Jackson St & Maynard Ave S SB | 195.5 |
16:45 | 17:00 |
| 6070 | Aurora Ave N & Lynn St SB | 189.4 |
8:15 | 8:30 |
| 71355 | SR 520 & Evergreen Point Rd WB | 188.1 |
7:15 | 7:30 |
| 7430 | Wall St & 5th Ave SB | 187.1 |
7:30 | 7:45 |
| 6100 | Aurora Ave N & Galer St SB | 183.8 |
8:30 | 8:45 |
| 1690 | 3rd Ave & Vine St NB | 183.0 |
17:15 | 17:30 |
| 375 | 2nd Ave Ext S & Yesler Way EB | 173.4 |
17:00 | 17:15 |
| 2220 | 3rd Ave & Cedar St SB | 170.1 |
7:15 | 7:30 |
| 81294 | 1st Ave NE & NE 140th St SB | 168.9 |
15:30 | 15:45 |
| 1558 | Columbia St & Alaskan Way SB | 166.1 |
17:15 | 17:30 |
| 420 | 3rd Ave & Virginia St SB | 162.1 |
16:30 | 16:45 |
| 75410 | Stevens Way & Pend Oreille Rd EB | 158.6 |
16:45 | 17:00 |
| 6320 | Aurora Ave N & Lynn St NB | 156.3 |
17:15 | 17:30 |
| 6300 | Aurora Ave N & Galer St NB | 149.3 |
17:30 | 17:45 |
| 1070 | Olive Way & Terry Ave EB | 148.8 |
17:15 | 17:30 |
| 75414 | Stevens Way & Benton Ln EB | 143.3 |
16:45 | 17:00 |
| 25798 | 25th Ave NE & NE 80th St NB | 143.3 |
7:45 | 8:00 |
| 2200 | Queen Anne Ave N & W John St SB | 142.9 |
8:30 | 8:45 |
| 6176 | 7th Ave N & Thomas St SB | 141.3 |
7:30 | 7:45 |
| 75405 | Grant Ln & Stevens Way WB | 132.8 |
16:15 | 16:30 |
| 628 | 4th Ave S & S Washington St WB | 127.9 |
8:45 | 9:00 |
| 548 | 3rd Ave & Madison St NB | 126.1 |
8:45 | 9:00 |
| 11352 | 15th Ave NE & NE 42nd St NB | 125.6 |
16:30 | 16:45 |
| 538 | 3rd Ave & Columbia St NB | 125.2 |
17:00 | 17:15 |
| 3600 | S Jackson St & 12th Ave S WB | 125.0 |
16:00 | 16:15 |
| 430 | 3rd Ave & Pine St SB | 124.7 |
16:30 | 16:45 |
| 22820 | 35th Ave SW & SW Avalon Way NB | 124.1 |
7:30 | 7:45 |
| 23925 | 25th Ave NE & NE 47th St SB | 123.3 |
8:15 | 8:30 |
| 26860 | Fremont Ave N & N 34th St NB | 121.1 |
17:15 | 17:30 |
| 26510 | Fremont Ave N & N 34th St SB | 120.7 |
7:45 | 8:00 |
| 9584 | University Way NE & NE 45th St NB | 120.3 |
16:30 | 16:45 |
| 9132 | University Way NE & NE 50th St NB | 120.1 |
8:45 | 9:00 |
The Belltown Funnel
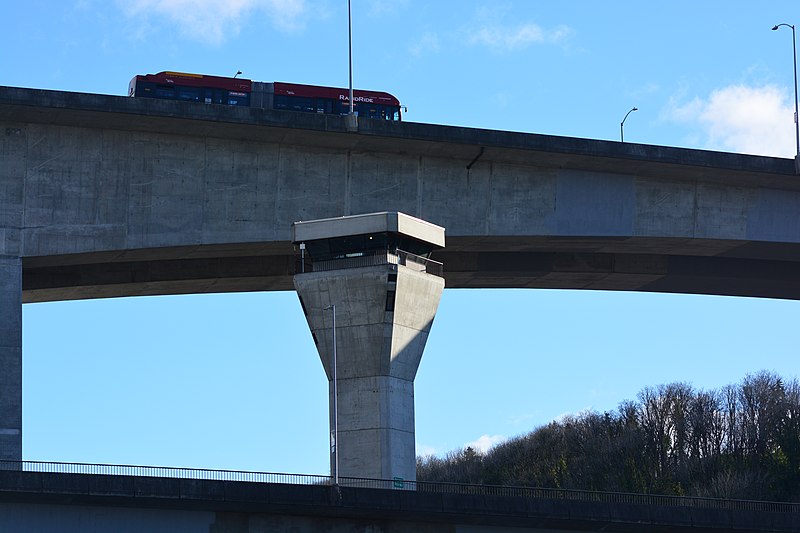
The largest average load is at stop 605, 3rd Ave & Bell St northbound, in the 17:00 to 17:15 window. The value of 325.2 is far beyond the capacity of a 60-foot bus, and no seat removal shenanigans are going to change that. This isn’t the full story with this stop, though. Under the restructure, it’s one of the few stops served by more than one route. One of them, the RapidRide D Line, has service every ten minutes. Using ten minute windows, the maximum load decreases to 289.5. Some of this load would be relieved by route 4 serving this stop as well. Unfortunately this still seems to leave more than two buses worth of passengers.
One way around this is to rethink what a “bus worth of passengers” means. Bi-articulated buses are used in South America and Europe. While some only run in dedicated busways, others run on typical city streets. The Volvo Gran Artic 300 has a stated capacity of 300, though this is at the higher end among the type. Procuring these vehicles would be unprecedented for an American transit agency. No bus manufacturer in the United States produces them, and the Buy America Act would hinder (but not necessarily prevent) buying them with federal funds. On busier RapidRide routes, buses like these could make a lot of sense. These routes tend to stay on straight, wide roads. Bigger buses could be a defining characteristic of the RapidRide program. It currently strains the definition of Bus Rapid Transit by using buses that differ only in paint job, having stops more closely resembling conventional bus stops than transit stations, and having headways that aren’t always dissimilar from those of other popular routes. With this kind of equipment, running RapidRide routes with consistent 10-minute headways looks much more feasible.
At this stop, though, even a 300-passenger bus every ten minutes might not be enough for peak loads. Compromising a little on the rules of the restructure could solve this. I am considering adding E Line service to this stop in the next revision of the proposal. The current version moved the E Line from this stop to take a different path through downtown; this would restore it to its present path. The D and E Lines, run with larger-capacity buses, would collect load from other routes and send it to downtown and the Link. Two buses, with a capacity of over 200 passengers each, every 10 minutes, seem adequate for this job.
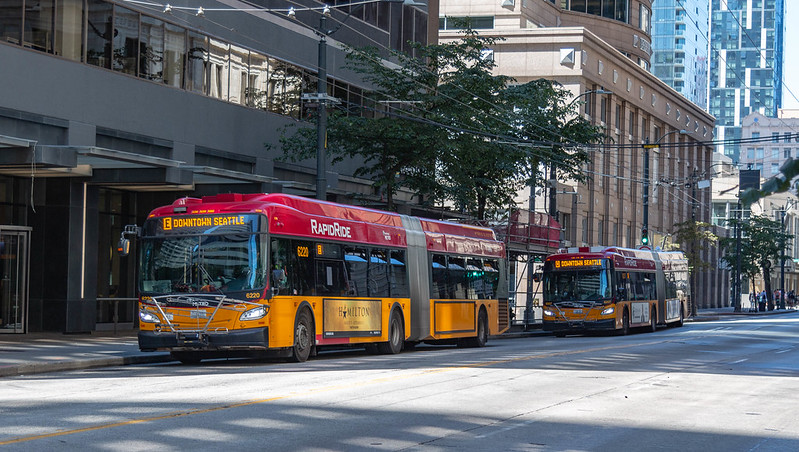
“Seattle RapidRide D Line & E Line | NFI XDE 60 | 3rd Ave @ Madison St” by Han Zheng is licensed under CC BY-SA 2.0.
The aforementioned approach would also mitigate crowding at stop 605, 3rd Ave & Virginia St northbound, which ranks second for both window lengths. It has a 15-minute peak average load of 258.9 and a 10-minute peak average load of 215.4. Crowding concerns would also be rectified for stop 400—3rd Ave & Bell St southbound and stop 420—3rd Ave & Virginia St southbound. Stop 1690—3rd Ave & Vine St northbound—and stop 2220—3rd Ave & Cedar St southbound, would remain only served by the D Line. With maximum loads of 146.8 and 127.9 under 10-minute windows, a single bi-articulated bus at this frequency should be more than adequate.
To and From West Seattle
From 17:15 to 17:30, an average load of 210.4 passes through stop 1562, Alaskan Way S & S Jackson St southbound. There are two C Line trips, three H Line trips, and a trip on route 56. How the restructure interacts with this stop is somewhat complex.
In the current version of the restructure, only the H Line will stop here, and it will have started from International District/Chinatown Station rather than downtown. The C Line will not stop here; it will not even cross the West Seattle Bridge, in favor of a terminal that connects it to the King County Water Taxi. The other option for crossing the bridge will be route 56, connecting SODO Station and Alki Beach. This route will connect with other north-south routes in West Seattle, concentrating West Seattle passengers who want to cross the bridge.
My assumption is that most of the load that passes through this stop comes from downtown. This is reflected in the similarly high passenger counts seen upstream at stop 1559, Alaskan Way & Columbia St. Under the restructure, these riders from downtown would take the Link to either International District/Chinatown Station and connect to the H Line, or take it to SODO and connect to route 56. If the capacity were to get split fairly evenly, it’s possible to see this as filling up two 60 foot coaches to just under capacity. The revised H Line has 10-minute frequencies, though. Looking at 10-minute windows the highest load is 137.3—still over capacity, but not by much. The loads for the stops serving the opposite direction, 1561 and 1558, tell a similar story.
“Spokane Street Bridge control tower 02” by Joe Mabel is licensed under CC BY-SA 4.0.
I haven’t been completely happy with the West Seattle portion of the restructure, and considering the load has provided an additional reason to revise it. Using route 56 as a collector of north-south routes looks great as a line on the map, but the pedestrian environment isn’t great for transfers. I’m leaning towards having both the C Line and the H Line cross the West Seattle Bridge, providing two buses worth of capacity every 10 minutes. Given the 10-minute maximums for stop 1559, this seems like a comfortable amount. If passengers heavily favor one path to West Seattle over the other, there is a risk of crowding. In that event, the solution of larger buses could be considered for these RapidRide routes as well.
Jackson Street
A variety of vehicle types traverse the stretch of South Jackson Street between 4th Avenue South and 12th Avenue South. Some of Metro’s trackless trolley routes serve stops on the sidewalk, accompanied by the occasional diesel-electric hybrid on other routes. The First Hill Streetcar serves platforms in the middle of the street. The whole arrangement is somewhat clunky. The stops are offset such that bus and streetcar stops aren’t on the same block. Someone who just wants to travel this stretch of Jackson Street needs to make a decision between waiting on the sidewalk, the center platforms, or just walking. This configuration also hinders transfer opportunities and thus fails to maximize the service investment. Consolidation to a single route isn’t just a tool for reallocating redundant service hours. On this street, it removes the anxiety of deciding where to wait.
The number of routes suggest that the stops along this stretch sometimes see high loads. Stop 1480—S Jackson St & Maynard Ave S eastbound—sees a maximum average load of 195.5 between 16:45 and 17:00. For stop 3600—S Jackson St & 12th Ave S westbound—it’s 125 passengers between 16:00 and 16:15.
Under the restructure, this stretch would only be served by a First Hill Streetcar that operates with 10-minute headways all day. For these two stops, the shift to 10-minute windows changes the maximum loads to 166.8 and 104, respectively. This would be on top of the riders already in the streetcar, for which I do not yet have per-stop load. The former would be beyond the capacity of a 60-foot bus, but with Inekon Trio Type 121 streetcars operating the route instead, the capacity limit is greater. Unfortunately, it’s not clear by how much; a Wikipedia article cites a capacity of 140 without a clear attribution. If the same multiplicative factor that relates Metro’s capacity for a 60-foot bus and the manufacture’s stated capacity were applied, the streetcar’s capacity would be 207. I suspect a reasonable number is somewhere between these two.
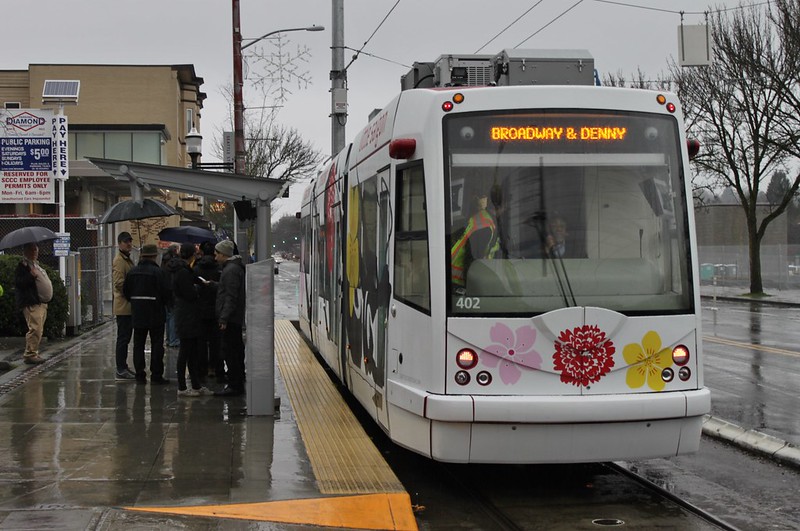
“First Hill Streetcar inaugural ride at Broadway & Denny” by SounderBruce is licensed under CC BY-SA 2.0.
Pushing the streetcar to eight-minute headways brings the maximum load to a comfortable 125.9, but would require the procurement of additional streetcars. With Seattle’s current aimless approach to its streetcar program, this may not be a prudent long-term investment.
I’m more reluctant to add an overlaying bus to diffuse load than I would be in other places, due to the lack of shared platforms. Either bus service or streetcar service should be eliminated here. The city must determine the future of its streetcar network before I would recommend vehicles be acquired—or perhaps sold off with the system abandoned. In the interim, I’m assuming that 10-minute streetcar service could be made to work, though this does involve some unchecked assumptions.
Aurora Avenue and Adjacent
The Aurora Bridge is one of the few paths over the Lake Washington Ship Canal not impacted by boat traffic. This makes it a common path for a routes that connect downtown Seattle to points north. Several stops here got flagged as having concerning load. Stop 6070—Aurora Ave N & Lynn St southbound—reaches a load of 189.4; stop 6100—Aurora Ave N & Galer St southbound—reaches a load of 183.8; stop 6320—Aurora Ave N & Lynn St northbound—reaches a load of 156.3; and stop 6300—Aurora Ave N & Galer St northbound—reaches a load of 149.3. Making up the path between downtown and the bridge, are stop 7430—Wall St & 5th Ave southbound—which reaches 187.1 passengers, and stop 6176—7th Ave N & Thomas St southbound—which serves 141.3.
Under the next revision of the restructure, the E Line will serve all these stops (in the current proposal it serves all but 7430). With its 10 minute frequency, the highest load drops to 158.5. If the aforementioned plan for running the E Line with bi-articulated buses were to be adopted, this load would not be concerning.
The University of Washington Campus
The University of Washington sits between two Link stations, and a variety of buses run through it. This, combined with the fact that students are more likely to be transit dependent, leads to heavily loaded vehicles passing through. This is highlighted by a maximum average load of 158.6 at stop 75410—Stevens Way & Pend Oreille Rd eastbound. Other stops of concern are stop 75414—Stevens Way & Benton Ln eastbound and 75405—Grant Ln & Stevens Way westbound.
The restructure proposal replaces this service with a single route connecting the campus with U District Station and points north. With this route operating with only 15-minute headways, this needs to be rethought. Bumping up the headway is one option, but in this case I’m favoring something else. Another route running through campus would not just dissipate some load, but could restore easy access to points to the east and northeast that would be otherwise lost. I plan on exploring this direction in a subsequent version of the restructure.
West of Campus
Directly to the west of the University of Washington campus, several bus routes run on the adjacent streets of 15th Avenue Northeast and University Way Northeast. The idea of having routes on two adjoining streets strikes me as suboptimal. The stops are far enough apart to hinder transfers between routes, while close enough to not serve different destinations. In the proposal, all service is consolidated onto 15th Avenue, enabling a pedestrianized University Way.
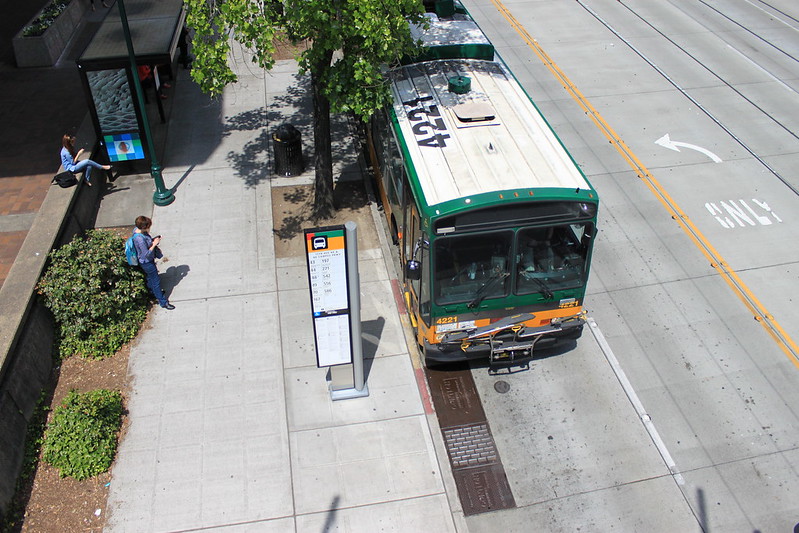
“KCM 4221 at 15th & Campus Pkwy” by SounderBruce is licensed under CC BY-SA 2.0.
This means that loads associated with the routes on these two streets will be combined, and stops on both already see heavy loads. Stop 11352—15th Ave NE & NE 42nd St northbound—sees a maximum average load of 125.6, stop 9584—University Way NE & NE 45th St northbound—has 120.3, and stop 9132—University Way NE & NE 50th St northbound—handles 120.1.
Concerns around stop 9132 are minimal, as the load is over-reported due to a data error. At this stop, route 75 trips turn into route 45 trips in Metro’s ridership accounting. These passengers are double-counted when determining the load at the stop. Correcting this drops the average load by 28.3 passengers, bringing it below the threshold of concern.
The other two are legitimate, but are mitigated by the fact that, under the restructure, this corridor continues to be served by multiple routes. It’s a natural choke point: the presence of overhead wire on 15th Avenue causes a variety of trolley buses to converge there, and its proximity to U District station means that additional routes would continue to use it to access that station. To ascertain whether the restructure’s modifications would support the load, I broke down the loads by route. I wanted to try to infer the intended destinations of riders and see if the restructured service provided enough capacity.
For stop 11352, the two trips on route 44 have a combined load of 73.7. Under the restructure, route 44 no longer serves this stop, but continues to stop at U District station. Some of the load associated with route 44 at this stop might disappear, as passengers originating nearby board the bus in a different place. Another portion of the load may have come from further south on 15th Avenue Northeast or Northeast Pacific Street. There are no load issues on the northbound stops on these streets. These passengers should be adequately covered by the remaining route 48. The 48 trip appearing at this stop within this time window only has a load of 10.5.
Two route 372 trips combine for a load of 24.5. This is near the end of the route, with the only major remaining destination being U District Station. These passengers would be accommodated by route 67, which traverses the same path on campus as route 372. The 10.2 route 20 passengers would add load to either the Link, route 44, or route 67, depending on which part of the existing route they want to reach. While route 44 is well-loaded at this point, it’s not beyond the point of capacity concern. The 6.7 route 70 passengers would be unaffected, as its route in this area is not changing.
At stop 9584, most of the load—77.7 passengers—is coming from two route 45 trips. Based on where this bus comes from and goes, these passengers would likely use route 67 for this part of their journey, before connecting to the revised route 45 in Roosevelt. Those who currently board route 45 on the western end of campus may find it more effective to walk to the Link, and use it to connect. In the worst case, this would bring the route 67 load up to 102.4. Determining the intention of the 24.7 route 73 passengers is more difficult. If they don’t want to go further north than Northeast 50th Street, route 48 is available, and without capacity concerns. For longer trips, route 67 is an option. If every passenger moves over it, though, the ability to run 15-minute frequencies on route 67 with conventional buses becomes doubtful. I don’t think that this would happen though. Under the restructure, passengers originating at the University of Washington Medical Center who currently ride the 73 long distance are best served by taking the Link 1-Line to Roosevelt Station, and connecting to a route serving Roosevelt Way Northeast or Lake City Way Northeast. Rounding out the capacity are 17.9 route 79 passengers, who are within walking distance of its new stops near U District station, and unlikely to add load to any other route.
Any analysis of where riders will end up after a restructure is speculative and subject to error, and this is but a cursory one. Nothing can fully assuage fears of severe crowding in this area. With the data available I hardly think that it is inevitable.
Gateway to Fremont
The Fremont Bridge collects several transit routes going from downtown Seattle to points north. Though some of the routes change with the restructure, the convergence remains. Stop 26860—Fremont Ave N & N 34th St northbound—has a maximum average load of 121.1, and stop 26510—Fremont Ave N & N 34th St southbound—serves 120.7. Like the last area, the adequacy of the restructure is predicated on a favorable breakdown of the distribution of this load.
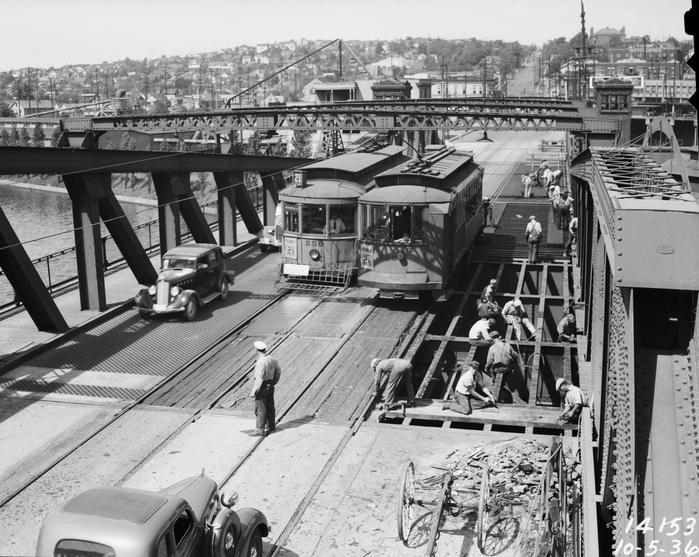
“Streetcars on Fremont Bridge, 1936” by Seattle Municipal Archives is licensed under CC BY 2.0.
For the northbound stop, the maximum load is made up of two route 40 trips totaling 65 passengers, a route 62 trip with 32, a route 32 trip with 13.5, and a route 31 trip with 10.6. In the other direction, the maximum load was made up of two route 62 trips totaling 53 passengers, two route 40 trips for a total of 59.3, and a route 31 trip with a load of 7.9. If the distribution of passengers remains spread between routes in this way, overloading seems unlikely.
The restructure reconfigures these routes to some extent. Route 32 is eliminated in favor of using a combination of route 31 and the D Line. Given the present load of route 31, and the D Line’s use of bi-articulated buses, overloading seems unlikely. Route 40’s path between South Lake Union and Northwest Market Street remains intact as route 6. Even if every passenger presently using route 40 was going between these destinations, there would be plenty of capacity with one bus every 15 minutes. More realistically, some passengers originating downtown would use the D Line’s more direct path and connect to the reconfigured route 18, if desiring destinations on 24th Avenue Northwest. Similarly, route 62 remains intact from Westlake to Roosevelt Station, with a slightly reconfigured routing to make a connection with the E Line at Aurora Avenue North. If originating downtown, accessing all parts of the original route can be done with a single connection off of the E Line or Link. In all, fewer passengers are likely to be passing over the Fremont bridge, mooting the concern about crowding at these specific stops. Even if the amount were to stay the same, the restructure doesn’t reduce the available capacity below the existing demand.
Odds and Ends
The 142.9 15-minute average maximum load at stop 2200—Queen Anne Ave N & W John St southbound—is mostly driven by D Line trips. With 10-minute windows dropping the maximum to 119.6, and bi-articulated buses on the D Line, this load does not concern me.
Stop 22820—35th Ave SW & SW Avalon Way northbound—has a maximum load of 124.1 given 15 minute windows. Presently, this is where routes 21 and the C Line converge on their way to the West Seattle bridge. In the present version of the restructure, neither of these cross it. Assuming that’s the goal of many of the passengers, they would be transferring to route 56. Judging from the load at this stop, they would overcrowd it. Earlier, I discussed my plan to rework this and send the C Line—with its higher 10-minute frequency—over the bridge instead. With the 10-minute windows, the highest load at this stop is 87.7, which makes this plan more palatable. It still might be useful to consider bi-articulated buses for the C Line. If it is one of only two options crossing the bridge, then it will pick up more connecting passengers from West Seattle than it does today.
Stop 23925—25th Ave NE & NE 47th St southbound—presents a somewhat unusual case. This stop is only served by route 372, has only one period of average load greater than 120—which at 123.3 is barely above the threshold, and has a second highest load of only 77.1. At the time that the heaviest load occurs, the route is running with its peak headway of approximately seven and a half minutes. A quirk in the schedule means that three trips are falling into the 15 minute window, when normally only two would. This barely pushes the load above the limit. Overloads are not seen around this time for other stops on the trip. For those reasons, I’m not inclined to treat this as problematic.
False Alarms
Stop 71355, SR 520 & Evergreen Point Rd westbound, reaches a maximum load of 188.1. This stop isn’t in Seattle, though, so service to it is unchanged. Stops 81294—1st Ave NE & NE 140th St southbound—and 25798—1st Ave NE & NE 140th St southbound—have high loads only because of Metro’s “Custom Bus” service to schools. These routes are not impacted by the restructure.
What About Downtown?
“Link Light Rail at Westlake Station” by Sound Transit Special Selection is licensed under CC BY 2.0.
The heavily loaded stops that haven’t been addressed yet are all located in downtown Seattle. Under the restructure, there is basically no north-south bus service in the downtown core. Some of the stops that are noted here for their considerable load would no longer exist! The idea is not for those riders to abandon transit, but for the Link to expand its role in bringing them to and through downtown. This necessitates that the Link has room to add passengers.
For the purposes of this post, I continued to ignore the constraint of the Link’s capacity. Refining that is the next step of this exercise. I am anticipating that load data comparable, or better than, Metro’s are available, but I have not yet acquired them. Making this analysis more complex is that load is moving between stops. In this post, it was largely possible to only look at the load for existing stops because they were still being served. All that changed was the frequency of service. There were so few cases otherwise that they could be analyzed ad-hoc. Downtown demands something more systematic.
This analysis depends on figuring out exactly where some suburban commuter routes will connect to the Link. The previous restructure only considered journeys within the city, so it was sufficient to just eliminate their in-city portions and redistribute the service hours. With the issue of load now in scope, the next version of the restructure will indicate where these routes actually terminate. This will not only provide a more accurate count of how many in-service hours can be reinvested, it enables running a county-wide access analysis with the restructure in place and discerning the impact that the restructure has on commuters into the city.
There are a lot of moving parts to assessing the restructure’s impact on service downtown, so I don’t expect this will be available any time soon. On top of that, the Link’s capacity is a moving target, as the system expands. For now, the concern that this restructure would cause overcrowding on the Link remains valid, though not conclusively supported.
Other Considerations and Next Steps
Like the stops downtown, there are a small number of other corridors where stops are eliminated. It’s expected that the current passengers using them will use nearby routes instead. It will be necessary to apply the same logic developed for downtown to move passengers and recheck the maximum loads. This is a frustratingly ambiguous process. As an example, for the service removed on 15th Avenue Northeast, it’s not clear whether passengers will use the stops on Roosevelt Way Northeast or Lake City Way Northeast. The only way to detect overcrowding is to look at both worst case scenarios, which adds further complication.
It is also worth noting something about how this analysis generates the time windows. When dividing the day into windows, it starts at midnight and generates 15 minute long periods, back to back. There are 14 other possible windows, by shifting the initial offset time between one and 14 minutes. The schedules that the restructure uses are preliminary. The trips of each route are not arranged into blocks, so their current starting times are only approximate. To be absolutely sure that the restructure wouldn’t cause an overload, it’s necessary to repeat the analysis for every offset, and take the highest load at each stop. I suspect this will not change anything considerably, and any measurement of ridership should be considered an estimate and not ground truth. Nevertheless, it’s worth verifying. While it’s somewhat tedious, it’s not complicated.
Assessing the Crowding Criticism
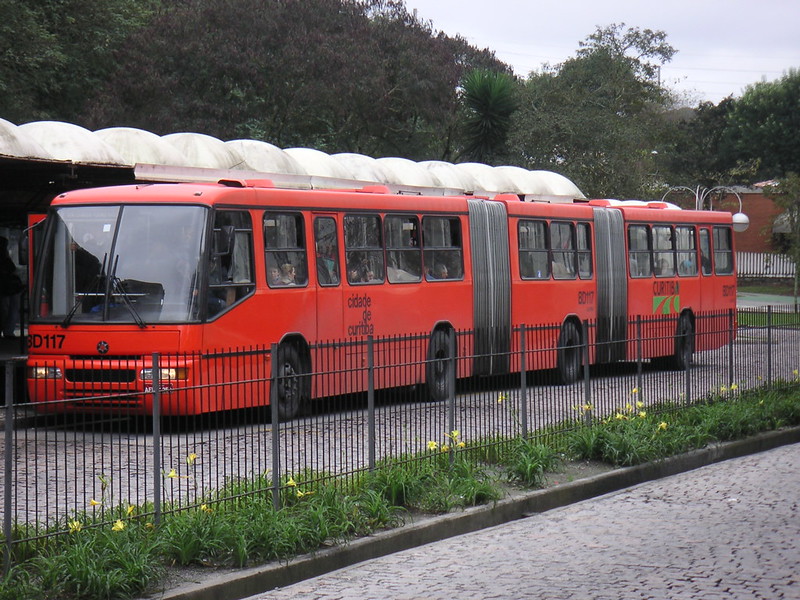
“Bi-Articulated Bus, Curitiba” by Thomas Locke Hobbs is licensed under CC BY-SA 2.0.
In one way, the results of this exercise justify The Urbanist’s decision to reject publishing the op-ed that outlined my uniform frequency restructure proposal. Their assertion was that it would cause crowding to the point of lost ridership at peak times. If this proposal were immediately enacted with King County Metro’s current passenger loads and bus fleet, this analysis shows that in all likelihood it would happen. That interpretation misses the point.
In a sense, the goal of the proposal was to reveal that a promised land—which no one has seemed to be interested in acknowledging—exists on the other side of a chasm. This would motivate the work to build a bridge across it. I hoped this could be a collaboration between the community of transit advocates and the region’s transit agencies. When that avenue was shut down, I had to start it alone.
There still isn’t a completed bridge, but this is the beginning of its construction. This work has shown that spanning the gap will require pushing some boundaries, relaxing some constraints, and changing parts of the restructure. Nevertheless, it is grounded in reality. The buses necessary for mitigating the overcrowding concerns don’t come from my imagination; they just come from Europe or South America. Asking passengers to stand may be unpopular. In the context of the service it enables, I can’t see how it isn’t the equitable choice. The changes to the restructure will not be vast, and they will maintain the benefits of uniform frequency, seven days per week, 24 hours per day. This proposal could still prove itself unrealistic, but it hasn’t yet.
-
Not even a trip-stop-time triple is unambiguous. A schedule may use minute resolution, and a vehicle might make a very short loop. This sounds ludicrous, but I’ve seen it in real transit data! Always use sequence numbers. ↩︎
-
I suspect they correspond to some fixed definition of the route, some trips of which might be truncated. ↩︎