“Sound Transit, Metro, ST transfer slip (Purple A)” by Oran Viriyincy is licensed under CC BY-SA 2.0.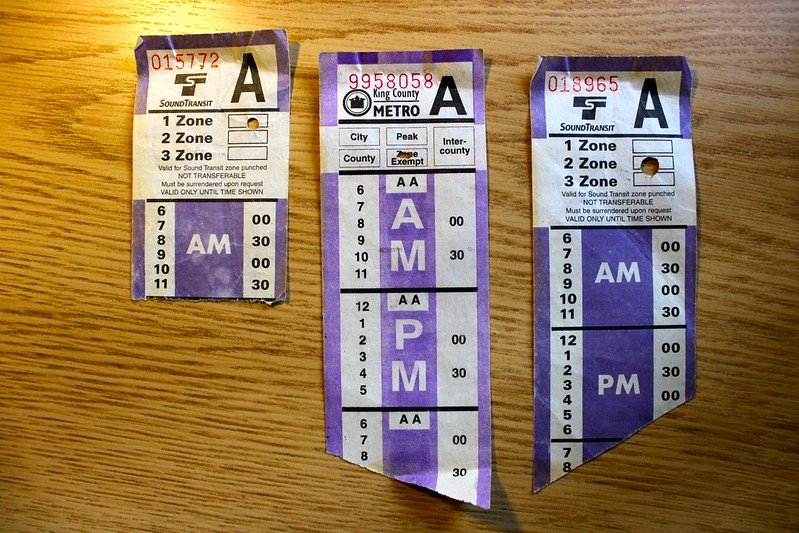
When I talk to occasional transit riders, I often experience a type of culture shock about transfers. They’ll mention, at times apologetically1, driving or taking an Uber to some place because there’s no bus route or train line that could get them there. That they refer to a singular one of these is weird to me. A public transit system is a network of interconnected routes; it’s unreasonable to expect all origin destination pairs to have a single route connecting them.
I don’t often seek to continue this line of dialog, because I’ve never found the conversation particularly fruitful or comfortable. A question starting with “Why didn’t you” is rarely appreciated when the recipient of the inquiry has already felt the need to apologize. Lacking confirmation, I suspect it comes down to time. Transferring, also known as taking a multi-seat ride, seems like it must take longer than a one-seat ride. One-seat transit rides themselves can already feel quite long. That taking multiple routes could be an efficient way to reach destinations might seem preposterous.
This is for all the one-seat riders. I wanted to understand how often a multi-route ride is the fastest way to reach a destination. The access analyses that I conduct can provide this information. Like the prior analyses, this one divides Seattle into a grid of 80 meter by 80 meter sectors, and for the combination of every sector and every minute of the day, computes which other sectors can be reached by transit and walking in 30 minutes. Instead of tallying which sectors can be reached, though, it notes which transit routes comprise the fastest path for each journey—the combination of origin, destination, and start time. When there are two possible ways to reach a destination at the same time, the tie is broken by which path has the fewest transfers. The paths of routes for each of the journeys are grouped based on how many routes comprise them, and are totaled.
| Number of Routes | Number of Journeys | Percent | Cumulative | Remaining | Unique Paths |
|---|---|---|---|---|---|
| 0 | 45,654,791,332 |
30.04% |
30.04% |
69.96% |
1 |
| 1 | 77,669,580,121 |
51.10% |
81.14% |
18.86% |
111 |
| 2 | 25,105,267,012 |
16.52% |
97.66% |
2.34% |
5316 |
| 3 | 3,337,921,125 |
2.20% |
99.86% |
0.14% |
34467 |
| 4 | 202,036,752 |
0.13% |
99.99% |
0.01% |
27747 |
| 5 | 10,506,980 |
0.01% |
100.00% |
0.00% |
3921 |
| 6 | 329,176 |
0.00% |
100.00% |
0.00% |
262 |
| 7 | 4,291 |
0.00% |
100.00% |
0.00% |
13 |
| Total | 151,980,436,789 |
Zero Routes
“File:Cable chains on bus, Seattle in 2008.jpg” by Oran Viriyincy from Bothell, WA, United States is licensed under CC BY-SA 2.0.
Sometimes, the best way to reach a destination on transit is to avoid transit altogether. In these access analyses, the unit of dividing land into potential origins and destinations is a square 80 meter by 80 meter sector. A walk between two adjacent sectors will take around a minute at most. So for sectors that are nearby, it is unlikely that walking to a stop, waiting for transit, and alighting elsewhere will be faster. Additionally, transit service in Seattle is scarce between 1 AM and 4 AM, which may result in a walk replacing a faster transit ride that was possible during the day.
This analysis uses a consistent walking speed of 1.4 meters per second, regardless of incline or terrain. I expect that the 30.04% quantity would vary considerably based on how fast an individual walks or what assistive devices that they use. I hope to examine that variability in future analyses.
One Route
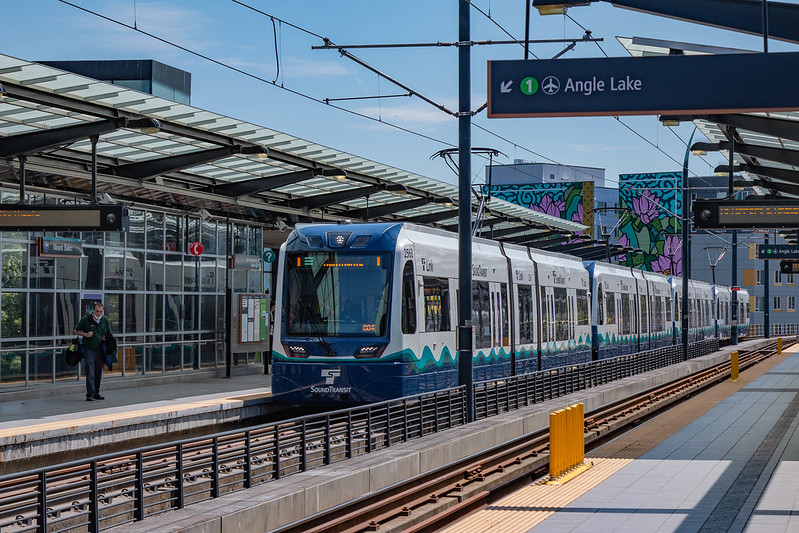
“Link Light Rail Line 1 | Siemens S700 | Mount Baker Station” by Han Zheng is licensed under CC BY-SA 2.0.
Are the multi-seat ride averse on to something? Zero- and one-seat rides make up a combined 81.14% of journeys. This is not an entirely surprising result. King County Metro’s threshold for considering a route frequent is 15 minute headways through most of the day. While there are routes and times with more frequent service, the common case is not ultra-high frequency. This means that walking and waiting just once can burn a significant portion of a 30-minute time budget. Having to do these parts more than once starts limiting the portion of the time budget actually dedicated to riding transit.
Within the one-route journeys, I broke out the top ten paths:
| Path | Number of Journeys |
|---|---|
| E Line | 4,528,044,795 |
| 1 Line | 4,425,457,810 |
| 40 | 3,732,758,899 |
| D Line | 3,636,293,990 |
| 7 | 3,281,106,161 |
| 65 | 3,184,040,303 |
| 75 | 3,147,519,759 |
| 5 | 2,931,186,300 |
| 62 | 2,440,678,735 |
| 36 | 2,437,314,370 |
I see no huge surprises here. Longer, more frequent routes enable a larger number of journeys. The Link 1 Line’s high rank is somewhat unexpected, because it has far fewer stops than its bus peers. This is balanced by being consistently frequent and covering large distances quickly. The latter means the trips between 1 Line stations are less likely to be replaced with walks than trips between closer bus stops would be.
Two Routes
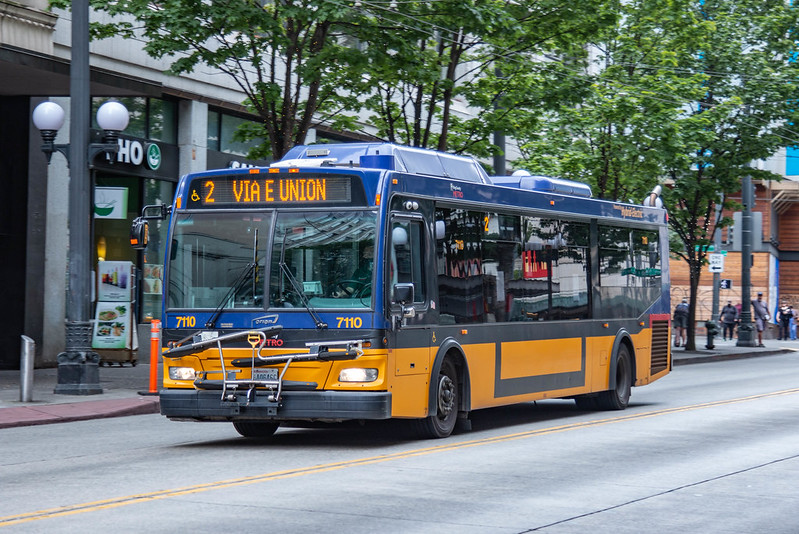
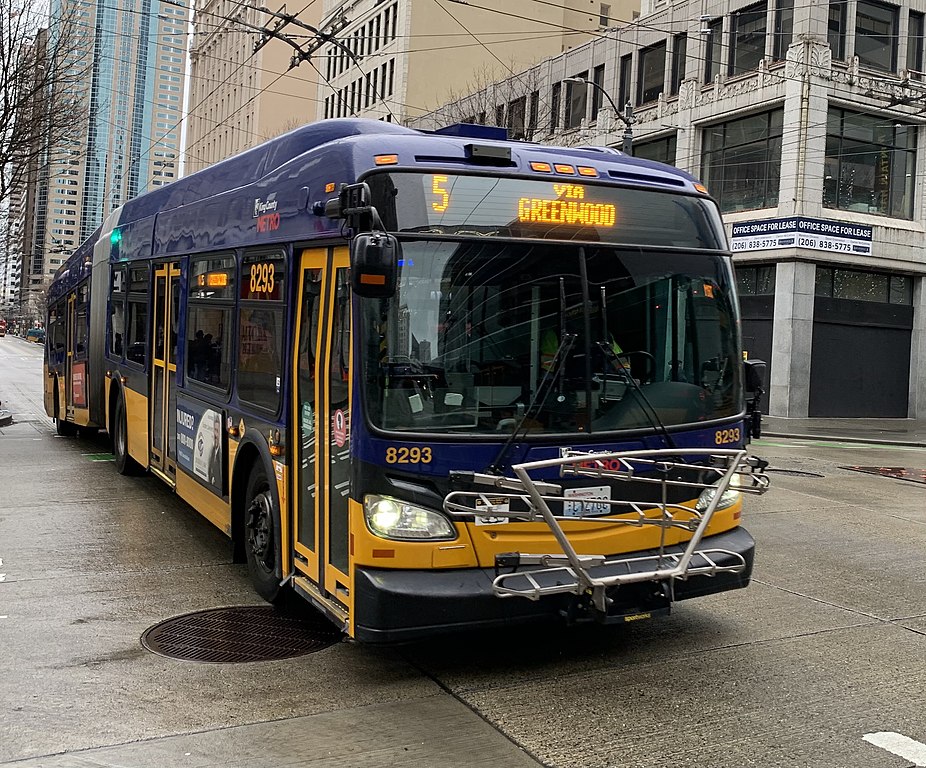
“Seattle Route 2 | OBI Orion VII EPA10 HEV | 3rd Ave near Pike St” by Han Zheng is licensed under CC BY-SA 2.0.
In approximately one-sixth of the possible journeys, ruling out a transfer means a longer trip time. I would consider this to be a substantial loss of transit connectivity.
| Path | Number of Journeys |
|---|---|
| D Line→40 | 269,488,350 |
| 1 Line→36 | 250,918,661 |
| 65→67 | 249,223,870 |
| 44→D Line | 240,296,617 |
| 75→45 | 236,998,323 |
| 36→1 Line | 234,538,116 |
| 40→D Line | 219,983,719 |
| D Line→44 | 201,241,295 |
| E Line→40 | 176,502,645 |
| 1 Line→50 | 174,118,270 |
Astute King County Metro riders might realize that two of these paths are not like the others. 65→67 and 75→45 are not true two-seat rides; the two routes in the path are through-routed such that the same vehicle seamlessly goes from serving the first route to serving the second. As such, there is not an explicit transfer; the passenger takes two routes merely by remaining on board. When this happens, it will be noted in each section.
I aggregated the findings by route count rather than seat count as a performance optimization. The route-counting component doesn’t retain the information to know if two trips are through-routed. But I think this is actually similar to the experience of an occasional transit rider. King County Metro’s service level maps aren’t very explicit about which routes tend to be through-routed, and some through-routes are not consistently paired throughout the day2. I would guess that an inexperienced rider who is planning a transit trip involving route 75 and route 45 would think about it as involving two vehicles. They will be pleasantly surprised (and perhaps initially confused) when the vehicle automatically changes its route.
The true two-seat rides involve frequent routes; only route 50 has an infrequent portion of its routing3. Many of these pairings also involve routes that cross each other multiple times. This is the case because the summation is strictly by route. A trip on route 36 from Little Saigon to International District/Chinatown Station followed by a 1 Line trip to Roosevelt Station, and a 36 trip from South Beacon Hill to Beacon Hill Station followed by taking the 1 Line to Mount Baker Station, will both be recorded as 36→1 Line. The 44→D Line pairing, and its reverse, do not have this property, but nevertheless rank well. The routes are more or less perpendicular, and I suspect the origin-destination pairs that they connect do not have many competing options.
Three Routes

“KCM 4181 in Downtown Seattle” by SounderBruce is licensed under CC BY-SA 2.0.
My interest in transit access is inspired in part by the work of transit planning consultant Jarrett Walker, who advocates for grid-like transit networks. In a perfectly flat world, with a consistently-space grid of routes, it would be rare to see a three-seat ride as the fastest path between points. One merely takes one route to move in the X direction, and another to move in the Y direction4 to reach any destination from any origin. For geographic and historic reasons, the transit network in Seattle is not a grid. Naturally, some three-route trips exist, and are the fastest path for 2.20% of the total journeys.
| Path | Number of Journeys |
|---|---|
| 67→65→49 | 26,750,485 |
| 65→67→32 | 19,328,855 |
| 75→45→32 | 18,559,989 |
| 75→45→31 | 18,110,293 |
| 50→1 Line→36 | 17,918,141 |
| 14→1 Line→36 | 17,438,378 |
| 36→1 Line→8 | 15,113,932 |
| 67→65→ 48 | 14,969,925 |
| 7→1 Line→36 | 14,808,977 |
| 62→65→67 | 14,039,665 |
| 36→1 Line→7 | 13,907,878 |
| 14→1→1 Line | 13,145,466 |
| 62→1 Line→44 | 13,040,685 |
| 36→1 Line→50 | 12,787,465 |
| 7→50→36 | 12,126,968 |
True three-seat rides are even more rare. All the paths with the 1 Line in the middle are actual three-seat rides. The 1 Line’s high frequency, and ability to cover a large amount of distance quickly, causes it to pair well with bus routes that stop more often. In this case, I’ve listed more than 10 paths because I wanted to find the most common three-seat ride that doesn’t involve the Link. Surprisingly, it is 7→50→36. The portion of route 50 that connects routes 7 and 36 is not frequent. It encounters these north-south parallel routes twice, though, providing multiple situations where it can be used to jump between them, in an area where east-west routes are otherwise not present.
Four Routes
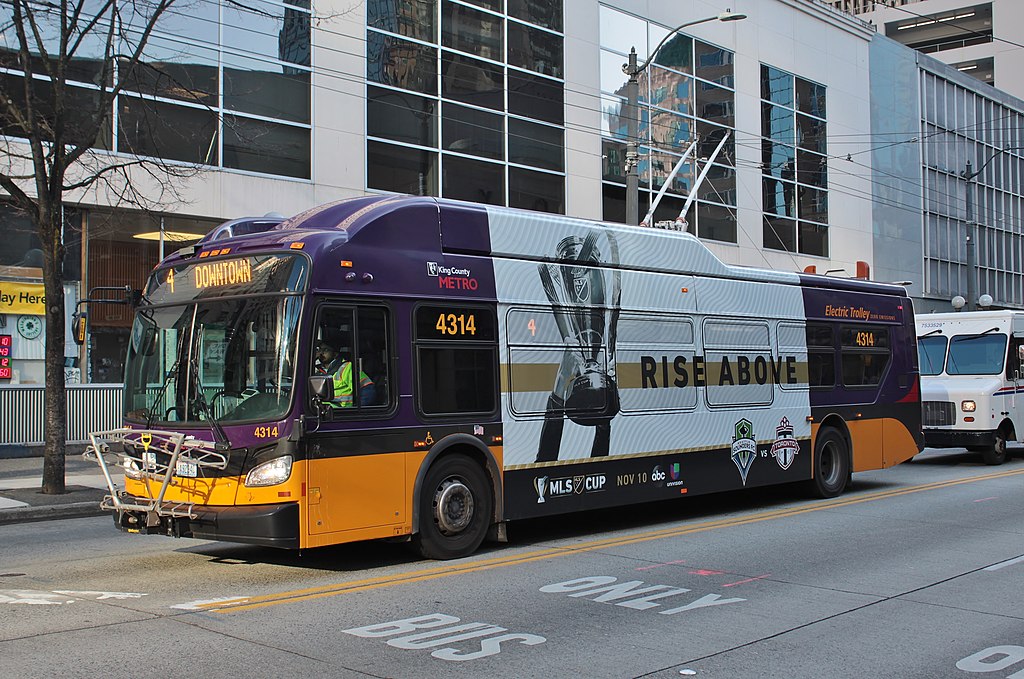
“King County Metro trolleybus 4314 with MLS Cup advertisement” by SounderBruce is licensed under CC BY-SA 4.0.
Three-seat rides aren’t common, but four-route rides are truly rare. Only 0.13% of the fastest paths consist of four routes, a reduction of an order of magnitude from the three-route rides.
| Path | Number of Journeys |
|---|---|
| 75→45→31→44 | 3,893,964 |
| 67→65→255→48 | 2,152,324 |
| 62→79→67→65 | 1,912,200 |
| 21→50→1 Line→36 | 1,901,190 |
| 65→67→32→44 | 1,410,539 |
| 5→21→14→1 Line | 1,293,179 |
| 75→45→31→1 Line | 1,118,601 |
| 62→44→43→48 | 1,117,390 |
| 36→1 Line→50→H Line | 1,104,251 |
| 8→48→14→1 | 1,087,096 |
| 32→24→124→E Line | 984,329 |
| 24→124→E Line→1 Line | 925,291 |
| 7→49→4→E Line | 923,686 |
| 24→124→E Line→C Line | 862,217 |
| 28→132→D Line→49 | 798,663 |
| 36→1 Line→50→21 | 726,180 |
Only two of these paths are true four-seat rides, 36→1 Line→50→21 and 36→1 Line→50→H Line. Both of these, I would assert, are examples of a feasible, useful 4-seat ride. So much transit service in West Seattle is dedicated to connecting to downtown. One of the few ways to reach it from other locations, without costly backtracking, is to take advantage of route 50 and its close connection to the 1 Line at SODO station.
Five Routes
“King County Metro IMG E0255” by AmaryahJohnson1996 is licensed under CC BY-SA 4.0.
These are not transit trips; these are stunts. I would not recommend them except for their novelty.
| Path | Number of Journeys |
|---|---|
| 75→45→31→1 Line→73 | 687,432 |
| 62→79→67→65→49 | 660,491 |
| 14→1→70→E Line→24 | 276,457 |
| 14→1→70→E Line→C Line | 234,613 |
| 1→8→13→2→E Line | 229,552 |
| D Line→8→13→2→E Line | 214,022 |
| 13→2→E Line→131→1 Line | 198,847 |
| 33→D Line→E Line→21→125 | 193,338 |
| 75→45→31→1 Line→67 | 154,817 |
| D Line→E Line→7→554→36 | 151,871 |
The true five-seat rides are D Line→E Line→7→554→36 and 33→D Line→E Line→21→125, but all these results look a little bonkers. When I first saw them, I was sure something was wrong with the analysis.
14→1→70→E Line→24 bothered me in particular. I checked the origin and destination sectors for the path, and they described a journey from 31st Avenue South to the southern part of Magnolia. Why would it involve jumping from route 1, to route 70, to the E Line, when they all cover the same stops through downtown? At 5:59 AM, both route 1 and route 70 reach 5th Avenue South and South Jackson Street. Route 1 takes 14 more seconds to reach Prefontaine Place South and Yesler Way. That would mean a missed connection with the E Line. Switching to the E Line allows a connection to route 24 that would be missed if remaining aboard route 1.
This is lunacy. I don’t understand why Metro is scheduling routes to have slightly different durations between the same pairs of stops at the same time of day. Is it accounting for different amounts of passenger load, and thus longer boarding and alighting times? Is it general schedule padding inserted at different places in different routes? Schedules for different routes being revised at different times, causing the time between the same stops to be out of sync? Regardless of what is happening, the analysis is producing technically correct fastest trips. They’re just trips that no one will, or should, ever employ in a serious attempt to reach their destination.
Six Routes
“Down to Bus Bay 6” by Atomic Taco is licensed under CC BY-SA 2.0.
Paths of six routes are two orders of magnitude more rare than five-route paths, comprising 0.000217% of the fastest journeys.
| Path | Number of Journeys |
|---|---|
| 14→1→70→D Line→H Line→121 | 93,597 |
| 5→21→18→1 Line→43→10 | 37,130 |
| 32→33→D Line→E Line→21→125 | 25,516 |
| 13→2→E Line→131→1 Line→36 | 20,822 |
| 1→8→13→2→E Line→150 | 18,705 |
| D Line→8→13→2→E Line→150 | 12,801 |
| 24→124→131→1 Line→106→60 | 10,934 |
| 24→124→E Line→C Line→3→60 | 10,486 |
| D Line→8→13→2→E Line→40 | 7,672 |
| 1→8→13→2→E Line→40 | 7,176 |
| 5→E Line→131→1 Line→36→7 | 6,556 |
I dug into several of these and encountered the same type of through-downtown bus-hopping shenanigans that appeared in the five-seat routes. 32→33→D Line→E Line→21→125 and 5→E Line→131→1 Line→36→7 are actual six-seat rides.
Seven Routes
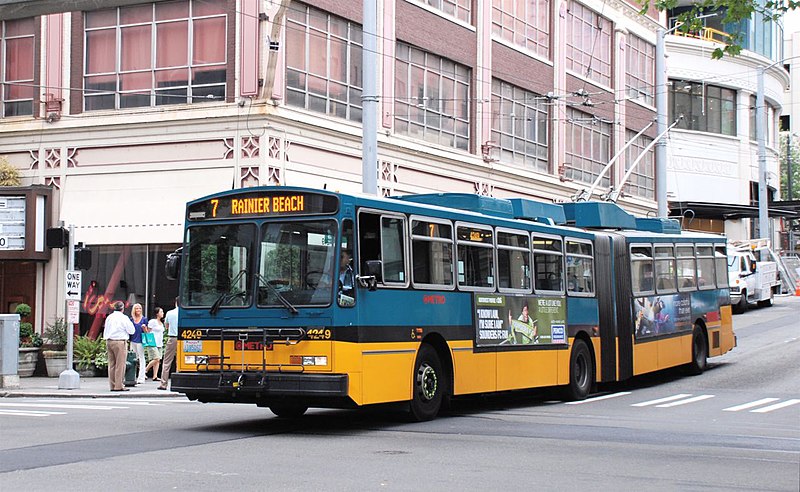
“File:Seattle Breda trolleybus 4249.jpg” by Steve Morgan is licensed under CC BY-SA 3.0.
Yes, it’s possible to take seven different transit routes in 30 minutes. Not only that, there are times of day where that seven-route path is the fastest way between some origin and some destination. This, of course, relies on seven transit vehicles running exactly on schedule. Pulling off one of these earns my undying respect.
These are all the seven-route paths. They represent 0.00000282% of all journeys.
| Path | Number of Journeys |
|---|---|
| 13→2→E Line→131→1 Line→36→7 | 3,381 |
| 5→5→21→18→1 Line→43→10 | 315 |
| 48→14→1→70→1 Line→H Line→121 | 248 |
| 33→D Line→E Line→21→1 Line→50→21 | 141 |
| D Line→8→13→2→E Line→40→1 Line | 84 |
| D Line→24→124→E Line→C Line→3→60 | 55 |
| 1→1→8→13→2→E Line→40 | 28 |
| 13→31→40→5→28→E Line→14 | 16 |
| 1→8→13→2→E Line→40→36 | 14 |
| 65→62→79→75→45→31→D Line | 6 |
| D Line→8→13→2→E Line→40→36 | 1 |
| 1→1→8→13→2→E Line→150 | 1 |
| 50→132→28→17→E Line→C Line→SLU Streetcar | 1 |
There are two true seven-seat rides among these, 33→D Line→E Line→21→1 Line→50→21 and 13→31→40→5→28→E Line→14. I find the former fun because in involves taking route 21 Express outbound for a single stop as part of some downtown bus-switching maneuvers, overshooting the final destination in SODO, and boarding a route 21 bus again, this time the local variant, towards downtown. Outside of these two, I find 5→5→21→18→1 Line→43→10 interesting, as it involves taking a bus in the opposite direction of the final destination to find a better place to cross a divided highway.
As unexpected as it is that a seven-seat ride can serve as the fastest way between two points, nothing about them is remarkable. They don’t reveal some practical, unintuitive way to more effectively use transit in Seattle. They are utterly impractical—examples of silly scheduling quirks that would be impossible to utilize under real-world circumstances.
Reflecting on the Journey
What is there to be gained by knowing the route-count distribution of 30-minute transit trips in Seattle? In one sense, it’s intrinsically interesting to reveal something that is not intuitive. I had no reason to believe that the longest path would be seven seats—not some other length like 15 or four. Examining long paths has served as a stress test for the routing algorithm used in these access analyses. These numbers are from the third iteration of the analysis; prior runs revealed overly-long paths caused by bugs in the algorithm. Outside of that, though, revealing the existence of 5-, 6-, and 7-route rides has little pragmatic value.
As a more practical matter, the 1 Line’s prevalence in practical and useful 3- and 4-seat rides show that its unique characteristics effectively complement bus service. It underscores how important it is to ensure high quality bus connections in future light rail expansion projects.
Above all, I hope that these findings will produce a more nuanced discussion about transfers. When I observe the machinations of transit planning as a somewhat-informed outsider, I see a tension between the seemingly arbitrary preferences of individuals, and what a transit network could be capable of providing if viewed with an open mind. This can play out as a transit agency proposing network changes that eliminate an existing one-seat ride, subsequent public complaints about transferring, and the transit agency acquiescing. I’m not saying that transit agencies should ignore this feedback; I think there is insight to be gained from it. The broad experiences of the general public may reveal gaps in the thought process of a single transit planner, or the software developer building tools for access analyses. At the same time, I think it is unwise to act as though all feedback is high quality.
If a transit network restructure is criticized for eliminating some one-seat rides, and the explanation for the criticism is that multi-seat rides will always make trips longer, that is low-quality feedback. These results show that for 18.86% of the 30-minute journeys in Seattle, that’s just not true. I would want to approach that criticism by gaining a greater understanding of the specific complaint. Are there assumptions made in the analysis that don’t anticipate the individual’s needs? Are there specific origins and destinations that the complainant cares about, and are longer trips between them being lost in the aggregate data? This may result in the parameters of the analysis being changed, or the results reinterpreted with more care, but decisions are never made in direct response to feedback. They’re the result of analyses that are progressively refined by it. If the commentator is not willing to be a party to that refining process, and provides only refutable generalities, I don’t think their feedback should be considered.
As someone who is not employed by a transit agency, I very well could be describing a process that is used internally, but not communicated outside. I have seen restructuring plans scuttled with the explanation of preserving one-seat rides, though. I hope that’s not the full story, and in fact the full story involved careful reanalysis that showed measurable regressions to transit access. Share this story in your public communications, transit agencies, and spare no details! My second request is for the obligate one-seat riders. I don’t know if data like this—or any data—is capable of changing minds. Give it the most fleeting thought before undertaking your next journey.
-
There’s no need for this. I’m sure I do something that offends your personal sense of good behavior. ↩︎
-
The two in this list, however, are consistently through-routed every day, all the time. ↩︎
-
Every other route 50 trip turns back at SODO Station rather than continuing to Othello Station via Seward Park. ↩︎
-
I use X and Y because the grid does not need to be oriented on the cardinal directions. It might be easier to think about East-West and North-South rather than X and Y, though. ↩︎