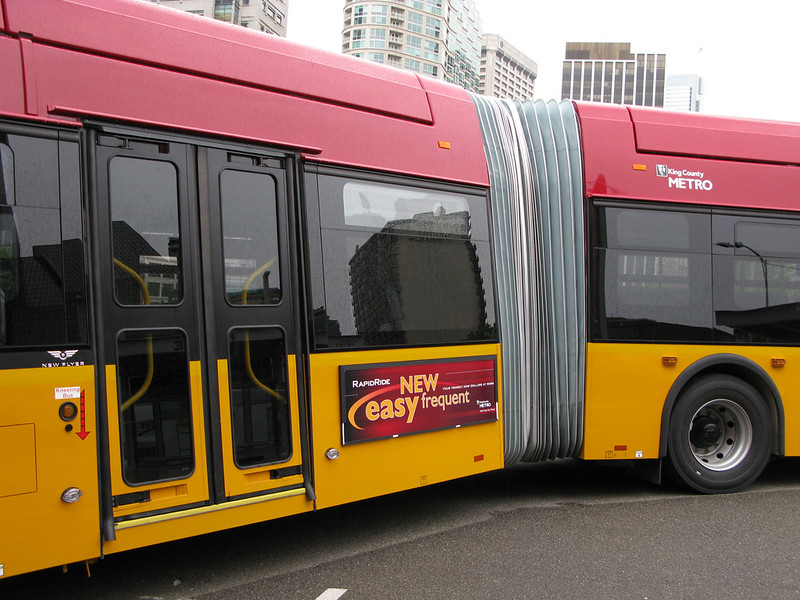
“RapidRide coach 6000 prototype” by Oran Viriyincy is licensed under CC BY-SA 2.0.
Twice a year, King County Metro revises its bus service. Most of the time, the revisions are small. Fluctuations in funding and the workforce may cause a few trips to be added or deleted, and construction projects may necessitate minor changes to routes. Often, the service revision is a non-event for riders, and the access implications are miniscule.
When Metro does make big changes, they’re typically in response to external factors. On September 14th, the agency will make its most substantial set of modifications in a few years. Sound Transit’s Lynnwood Link extension is opening at the end of August, and some Metro routes in North Seattle and Shoreline will change to connect to the new stations. Also, the construction of transit-priority features on Madison Street will be complete, enabling the launch of the RapidRide G Line. Some routes in that line’s vicinity will see changes as well. Amidst these additions and modifications are deletions of bus service from some corridors. This is a move that the agency has typically seemed loath to make. Often, cuts like this appear in early versions of a service revision, only to be rolled back when the agency receives complaints. While the deletions typically are intended to enhance service elsewhere, transit customers are loss-averse, and Metro is usually sensitive to negative feedback to a fault. In this case, some significant cuts survived several rounds of scrutiny.
Last week, Metro updated its GTFS schedules to incorporate the forthcoming service change. That allowed me to compute access measurements that reflect what riders in Seattle will experience when the new routes start running. If they are to be believed, riders are in for a mixed bag. For a service change that finally makes investments in new service after a pandemic and workforce shortages, that’s disappointing.
More Service, More Access, Less Efficiency
There is one unquestionably positive aspect of the service change: more transit service is coming to Seattle. Currently, on a typical weekday, there are 4,945 hours, 48 minutes, and 48 seconds of transit service time deployed to Seattle, between King County Metro and Sound Transit. After the service change, there will be 5,081 hours, 54 minutes, and 41 seconds, an increase of 2.75%. More service usually results in an increase in access; in this case, this is true across a variety of time budgets. The following table shows the access increase in terms of completed journeys.
| 20 minute | 30 minute | 45 minute | |
|---|---|---|---|
| Before Service Change | 53,359,397,039 |
149,724,612,731 |
402,040,925,709 |
| After Service Change | 53,455,078,243 |
150,589,265,676 |
407,196,796,757 |
| Change % | +0.18% |
+0.58% |
+1.3% |
These are not particularly large gains, given the availability of new funds. For reference, the restructure that I proposed increased access by 15% while reducing the budget allocated for weekdays. The upticks in access are proportionately less than the increases in service hours, leading to a reduction in the journeys per in-service second.
| 20 minute | 30 minute | 45 minute | |
|---|---|---|---|
| Before Service Change | 2,979 |
8,338 |
22,306 |
| After Service Change | 2,903 |
8,154 |
21,962 |
| Change % | -2.6% |
-2.2% |
-1.5% |
The decreases signify that the new service hours are being deployed inefficiently in terms of boosting unweighted access. In other words, this investment is funding transit trips that open up new destinations to riders at a worse rate than would be anticipated, given Metro’s current level of efficiency.
Outcomes Vary Geographically
While I’d argue that it should be, improving unweighted access is not a stated goal of King County Metro. Metro has other ways of measuring success, from relieving crowding to distributing service in an equitable manner. As of its last System Evaluation, there has not been unacceptable crowding on any trip. Therefore, the moves that it is making in this service change should reflect where it believes that there is the most need. A geographical breakdown of the change in access reveals which areas are most improved, and if that improvement is coming at the expense of other places.
The following map shows the access change that the revised network will bring, in Seattle, given a 30-minute time budget. More information is available when opening the map in the access viewer, including the ability to see the access change on a sector by sector basis. Click once on a sector to select it and see its access scores. Click it again to expand it and see the specific way in which its reachability changes. Click it a third time to restore the full network map.
Improvements
The RapidRide G project involved a significant rebuild of Madison Street to support transit-priority features, and the procurement of a specialized fleet of buses with doors on both sides to serve center-island stations. From 6 AM to 7 PM on weekdays, buses will run every 6 minutes. It represents a major investment in construction, equipment, and operations. Yet the sector with the largest access improvement is in distant Greenwood.
Sector 26904, just north of Greenwood’s center at the intersection of North 85th Street and Greenwood Avenue North, sees a mean score improvement of .0179 or 11.6%. The new route 61 connects Greenwood to Lake City via Northgate Station. Predictably, the benefit is realized largely by increasing the number of completed journeys that end on the east side of Interstate 5. Formerly, this area could be access by using route 45 and connecting to the Link at Roosevelt Station, but the new route obviates the need to initially go south in order to go northeast. Greenwood’s transit access was not bad before; this sector had a z-score of 1.28, making it comfortably above average for Seattle. This service change still represents a significant improvement, with this sector now being 1.66 standard deviations above the average. This will be accomplished not with special buses and rebuilt roadways, but just unspectacular all-day transit service with 15-minute headways.
Other sectors along routes 61’s path also show improvement. Sectors 26922 and 26796, near North 85th Street and Wallingford Avenue North, are the second and third most improved. The former increases by .0173 or 11.1%. Here the improvement seems to be less about making new connections, and more about bumping up the frequency of service between here and Lake City. Sector 28885, near Northgate Station, shows an improvement of 7.43%, improving its z-score from 2.57 to 2.90. Northgate Station’s location—wedged against the highway and offset from major east-west arterials—limits access compared to other stations. A route that goes west in a less circuitous way than routes 40 or 345 will make a difference. Continuing east, there are a few other sectors with similarly large improvements. Route 61 is allowing riders to connect to north-south routes on the other side of Interstate 5 within a 30-minute time budget, and its increased frequency improves the opportunities to make a connection in the Lake City area too. While Metro’s outreach materials for this revision have focused on the RapidRide G and the Link extension, route 61 may be its greatest achievement.
The sector with the 278th ranked improvement is the first one that is along the route of the RapidRide G Line. Sector 15654 is at the route’s eastern terminal, in the Madison Valley. The revised network will increase the access score by .0105 or 8.42%. This will not make a transit rider’s experience here exceptional compared to the rest of the city, with the z-score increasing only to 0.5805 from 0.3568.
Continuing down the list of improved sectors, a new location appears before the next sector along the G Line. Sector 4975, located along route 60’s alignment at the corner of East Marginal Way South and Corson Avenue South, ranks 392nd. The access will be improved by 0.0094 or 10.1%. This moves the sector from slightly below average for Seattle to slightly above it. A longer span of service for this route and some added trips seem to be responsible.
The G Line’s contributions reappear at the 475th ranked sector. This is sector 14511, near East Union Street and 13th Avenue, at the G Line’s intersection with route 2. The G Line’s frequency is providing more opportunities to get downtown faster, which is enabling new transfer opportunities within a 30-minute time budget. The score increase is 0.0024 or 12.7%. Comparable increases are seen along this alignment.
While the launch of the G Line headlines this service change, its access contributions do not outshine those of some far more unheralded revisions. Its six-minute headways will feel great for riders moving along its corridor; I miss having them on the Link dearly. For using transit to reach points throughout the city, though, going from route 12’s pedestrian 15-minute headways to the G Line’s exceptional six-minute ones isn’t a game changer. Creating an amazing way to move up and down a single corridor can only accomplish so much. Desirable destinations are all over the city, where far inferior transit service is commonplace.
Perhaps a 20-minute time budget would be more flattering to the G Line. For a shorter duration, higher frequency is more important as it minimizes waiting. Under this time budget, sector 15654 indeed becomes the ninth most improved sector. Continuing to best it are some of the sectors along route 61, highlighted when considering the 30-minute duration.
Surprisingly, a G Line-adjacent sector’s access increase is at its highest position when considering a 45-minute time budget. Sector 15654 ranks sixth most improved. Reaching downtown with more time to transfer seems to be driving this. The most enhanced sectors remain along route 61, but now are in the Victory Heights neighborhood. Sector 29574 is top ranked. Its access improvement can be attributed to route 61 making it easier for riders to go west, and then transfer to north-south service like route 5 and the E Line.
Finally, this service change returns trolleybus service to the Summit area of Capitol Hill, as an extension of route 3. Based on Metro’s documents, this was in response to considerable community feedback in favor of restoring it. Unfortunately, the way in which Metro is serving the neighborhood doesn’t change its access outcome very much. Sector 15965, located near the Bellevue Avenue East and Bellevue Place East terminal of the restored routing, has the greatest increase, but it ranks merely 5,668th of 32,470 overall, for a 30-minute time budget. Access to this sector remains below average, with the z-score increasing from -0.1887 to -0.1591. While transit service to this area dates back to streetcars from the early 1900s, perhaps it is time to rethink how this neighborhood is served. There are more options than a binary choice between no service and a low-frequency loop connecting it to downtown.
Degradations
For a 30-minute time budget, two distinct areas trade off the most-reduced sectors. I found one area entirely predictable, the other very surprising.
Sector 32292, located near Jackson Park, has the largest absolute access reduction. I found this surprising because, unlike some places, this is not an area where all nearby transit service will be removed. Route 65 used to directly serve this sector at its northern terminal. This terminal will no longer be used, as the route will be continuing to the 148th Street Link Station. Stops will remain nearby on Northeast 145th Street, but the added walk seems consequential for fitting a route 65 trip and a transfer to route 372 or 75 into a 30-minute budget. The deletion of route 73 will cause a reduction of access to destinations on 15th Avenue Northeast. The elimination of route 347 will reduce the maximum frequency of service between this location and Northgate Station. These changes combine to effect a reduction of 0.0154 or 17%. The third, fourth, and fifth most degraded sectors are also nearby. As a caveat, this measurement only considers trips that remain within Seattle. In reality, riders are allowed to enter Shoreline and connect to the Link at 148th Street station. So in truth, there may not be an access reduction here at all.
The second greatest reduction didn’t surprise me, because it’s in an area experiencing a complete elimination of service. Sector 22625 overlays a stretch of Latona Avenue Northeast between Northeast 54th Street and Northeast 55th Street. This is along the path of route 20, which will be deleted in this service change. The loss of that route will result in an access score reduction of 0.0149 or 15.5% here.
This elimination is particularly acute due to the area’s built environment and the limitations of nearby transit service. Route 67 provides frequent north-south service nearby, but can only truly be a replacement for locations near Latona Avenue Northeast’s intersections with Northeast 45th Street or Northeast 65th Street. In between those streets, Interstate 5 presents an impermeable barrier to accessing it. No such obstacle prevents riders from accessing route 62, but that route doesn’t directly enable trips to the north, and transfers are only possible after a circuitous path through Tangletown and East Green Lake. As such, most of the sectors along this street experience top-ranked reductions.
Many of the largest reductions not related to route 20 are along the aforementioned route 73, also slated for deletion without replacement. Outside of the previously-discussed cluster at Jackson Park, the reduction along this route peaks at sector 26343, which is ranked 56th. This is a reduction of .0098 or 7.01% for the area around the junction of Lake City Way Northeast and 15th Avenue Northeast. Generally the pattern holds that these reductions are smaller than those seen along route 20’s corridor. This indicates that there are alternatives in more cases, but not all of them.
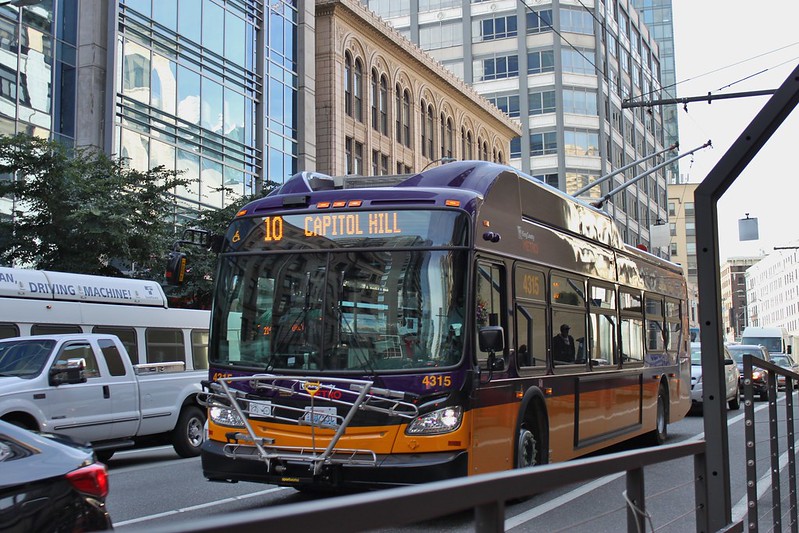
“KCM 4315 in Downtown Seattle” by SounderBruce is licensed under CC BY-SA 2.0.
Metro’s choices regarding the routes in the vicinity of the G Line also will negatively impact access. The agency’s outreach materials note that for routes 10, 12, and 49, “trip times will be adjusted to better match rider demand.” This is a euphemism for these routes being dropped to 20-minute frequencies from their current 15-minute ones. For a 30 minute budget, the access decreases are somewhat notable. They are comparable to those along the former route 73’s corridor even though service isn’t disappearing completely. When considering a 45-minute time budget, though, the sector with the greatest reduction is at route 10’s northern terminal. That is sector 16794, and the reduction in the mean score is .0217 or 7.84%. The frequency decrease is not the only contributor to this. Currently, route 10 passes by the Capitol Hill Link Station. The restructure will restore an old routing that keeps it on East Pine Street until 15th Avenue, never passing the station. Metro is trying to create a frequent corridor on East Pine Street by overlaying route 10 with a rerouted route 12. This comes at the cost of making the northeast portion of the route less useful by disconnecting it from a piece of transit infrastructure that can move a rider to many distant points quickly.
Why I’m Disappointed
I’m disappointed by this transit network, but I first want to clarify the points that I’m not disappointed about. I’m not disappointed that King County Metro is able to add new service hours. This is commendable and welcome. I’m not disappointed that this is an evolutionary change rather than a wholesale rethinking of Metro’s network. That can be frustrating as someone advocating for a complete restructure of the agency’s network in Seattle, but I understand that progress can be made in incremental steps. I’m not disappointed that Metro is deleting routes. I have no objection to eliminating them when reinvesting the service time results in better access. I’m not disappointed that Metro is creating routes out of whole cloth and rethinking others. I have high hopes for route 61. Sometimes the agency’s past revisions have felt too conservative, and I appreciate the boldness this time, even if I find it misdirected in some cases.
There is both a quantitative and qualitative way to express my disappointment. The former can be reduced to a single figure. The reduction in journeys per in service second disappoints me. For me, the draw of a city is being surrounded by opportunities and activities. New ones could emerge at any place, at any time. I never want to have to turn down an experience because a city’s transit service makes it infeasible to reach. At the same time, I understand that transit agencies don’t control the amount of funding that they receive. I just expect them to do everything they can, with the funds available, to quickly connect all people to an abundance of locations, all day, every day. Journeys per in service second captures this. When an agency fails to improve it when more funding becomes available, it feels like a squandered opportunity.
It’s hard to predict how individual route and trip modifications will impact journeys per in service second; that’s why it takes a fleet of computers to calculate it. Some qualitative features of a transit network will generally move it in a positive or negative direction, though. I see more negative features than positive ones in Metro’s service change.
Route redundancies are a negative feature, so are this service change’s route deletions a positive? Unfortunately, Metro’s choice to eliminate route 20 demonstrates an insufficient understanding of how to assess redundancy. The agency’s outreach materials indicate that alternatives exist in routes 44, 45, 61, and 62. While these routes are proximate to parts of route 20, the significant access loss along its corridor indicates that these routes are not true alternatives. They don’t allow transit customers to get to the same places, at the same time, without a large revision in time budget. Deleting routes is perfectly justifiable when other routes can pick up the slack; a network with less redundancy will deliver greater access for the same amount of service. Failing to assess the viability of alternatives, and thus deleting a route that is enabling unique journeys, is a bad approach to efficiently delivering access.
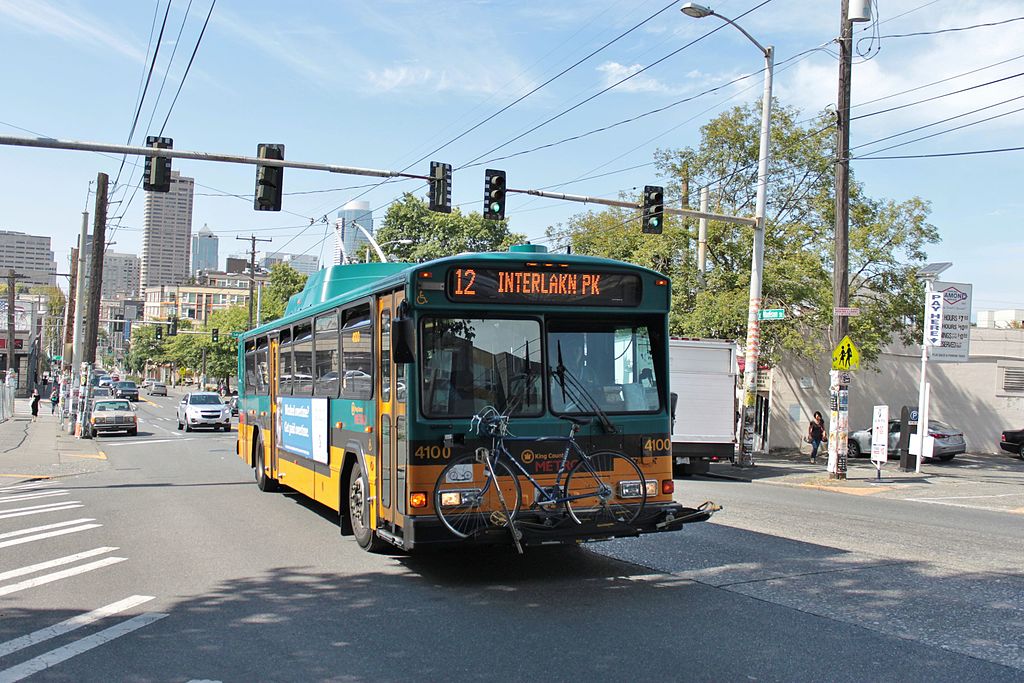
“King County Metro trolleybus on Madison Street, Seattle (20834580400)” by SounderBruce from Seattle, United States is licensed under CC BY-SA 2.0.
Metro’s choices regarding the G Line and Capitol Hill bus routes create large frequency disparities, another feature that negatively impacts the efficient delivery of access. Frequency reductions are obviously not good for access. People cannot go as far, at as many times, if they are waiting longer for a bus.
As frequency increases, though, there are diminishing access returns. This analysis demonstrates how lackluster the G Line’s access increases are compared to route 61’s, even though the former’s frequency is spectacular. I understand that Metro’s hands are tied in terms of the G Line’s frequency; there were stipulations tied to the Federal money used in its implementation, so it’s unfair to insist that Metro distribute its service hours to other routes. I can’t let Metro entirely off the hook, though, because, on its own volition, its changes to routes 3 and 12 stack more routes on Pike Street and Pine Street between downtown and Capitol Hill. I’m not sure what the purpose of this super-frequent corridor is, when there are areas with considerably less frequency elsewhere. Providing access throughout the city isn’t accomplished by creating disconnected frequent transit corridors. Accessing a breadth of places involves transferring. When some routes are starved for frequency at the expense of others, those transfers are harder to make, and city-wide access suffers.
That being said, I do acknowledge that there are obvious merits to this service change. It increases network-wide access, so, on the whole, riders will benefit. With an infusion of more service hours though, that’s an awfully low bar. King County Metro’s execution feels lacking and questionable. The increase in access lags behind the level of investment, which is a shame when the service change is responsible for measurable access reductions in some parts of Seattle. When I view this service change’s impact quantitatively, I’m merely disappointed by its inefficiency. When considering the qualitative aspects that engendered that quantitative deficit, I fear what it portends. Does Metro still appreciate the benefits of a city-wide, frequent network that supports experiencing the fullness of Seattle?