When the annual Fremont Solstice Parade celebrates the arrival of summer, King County Metro must reroute its buses around it. Routes 31, 32, 40, and 62 serve Fremont, and the parade forces them off their typical paths.
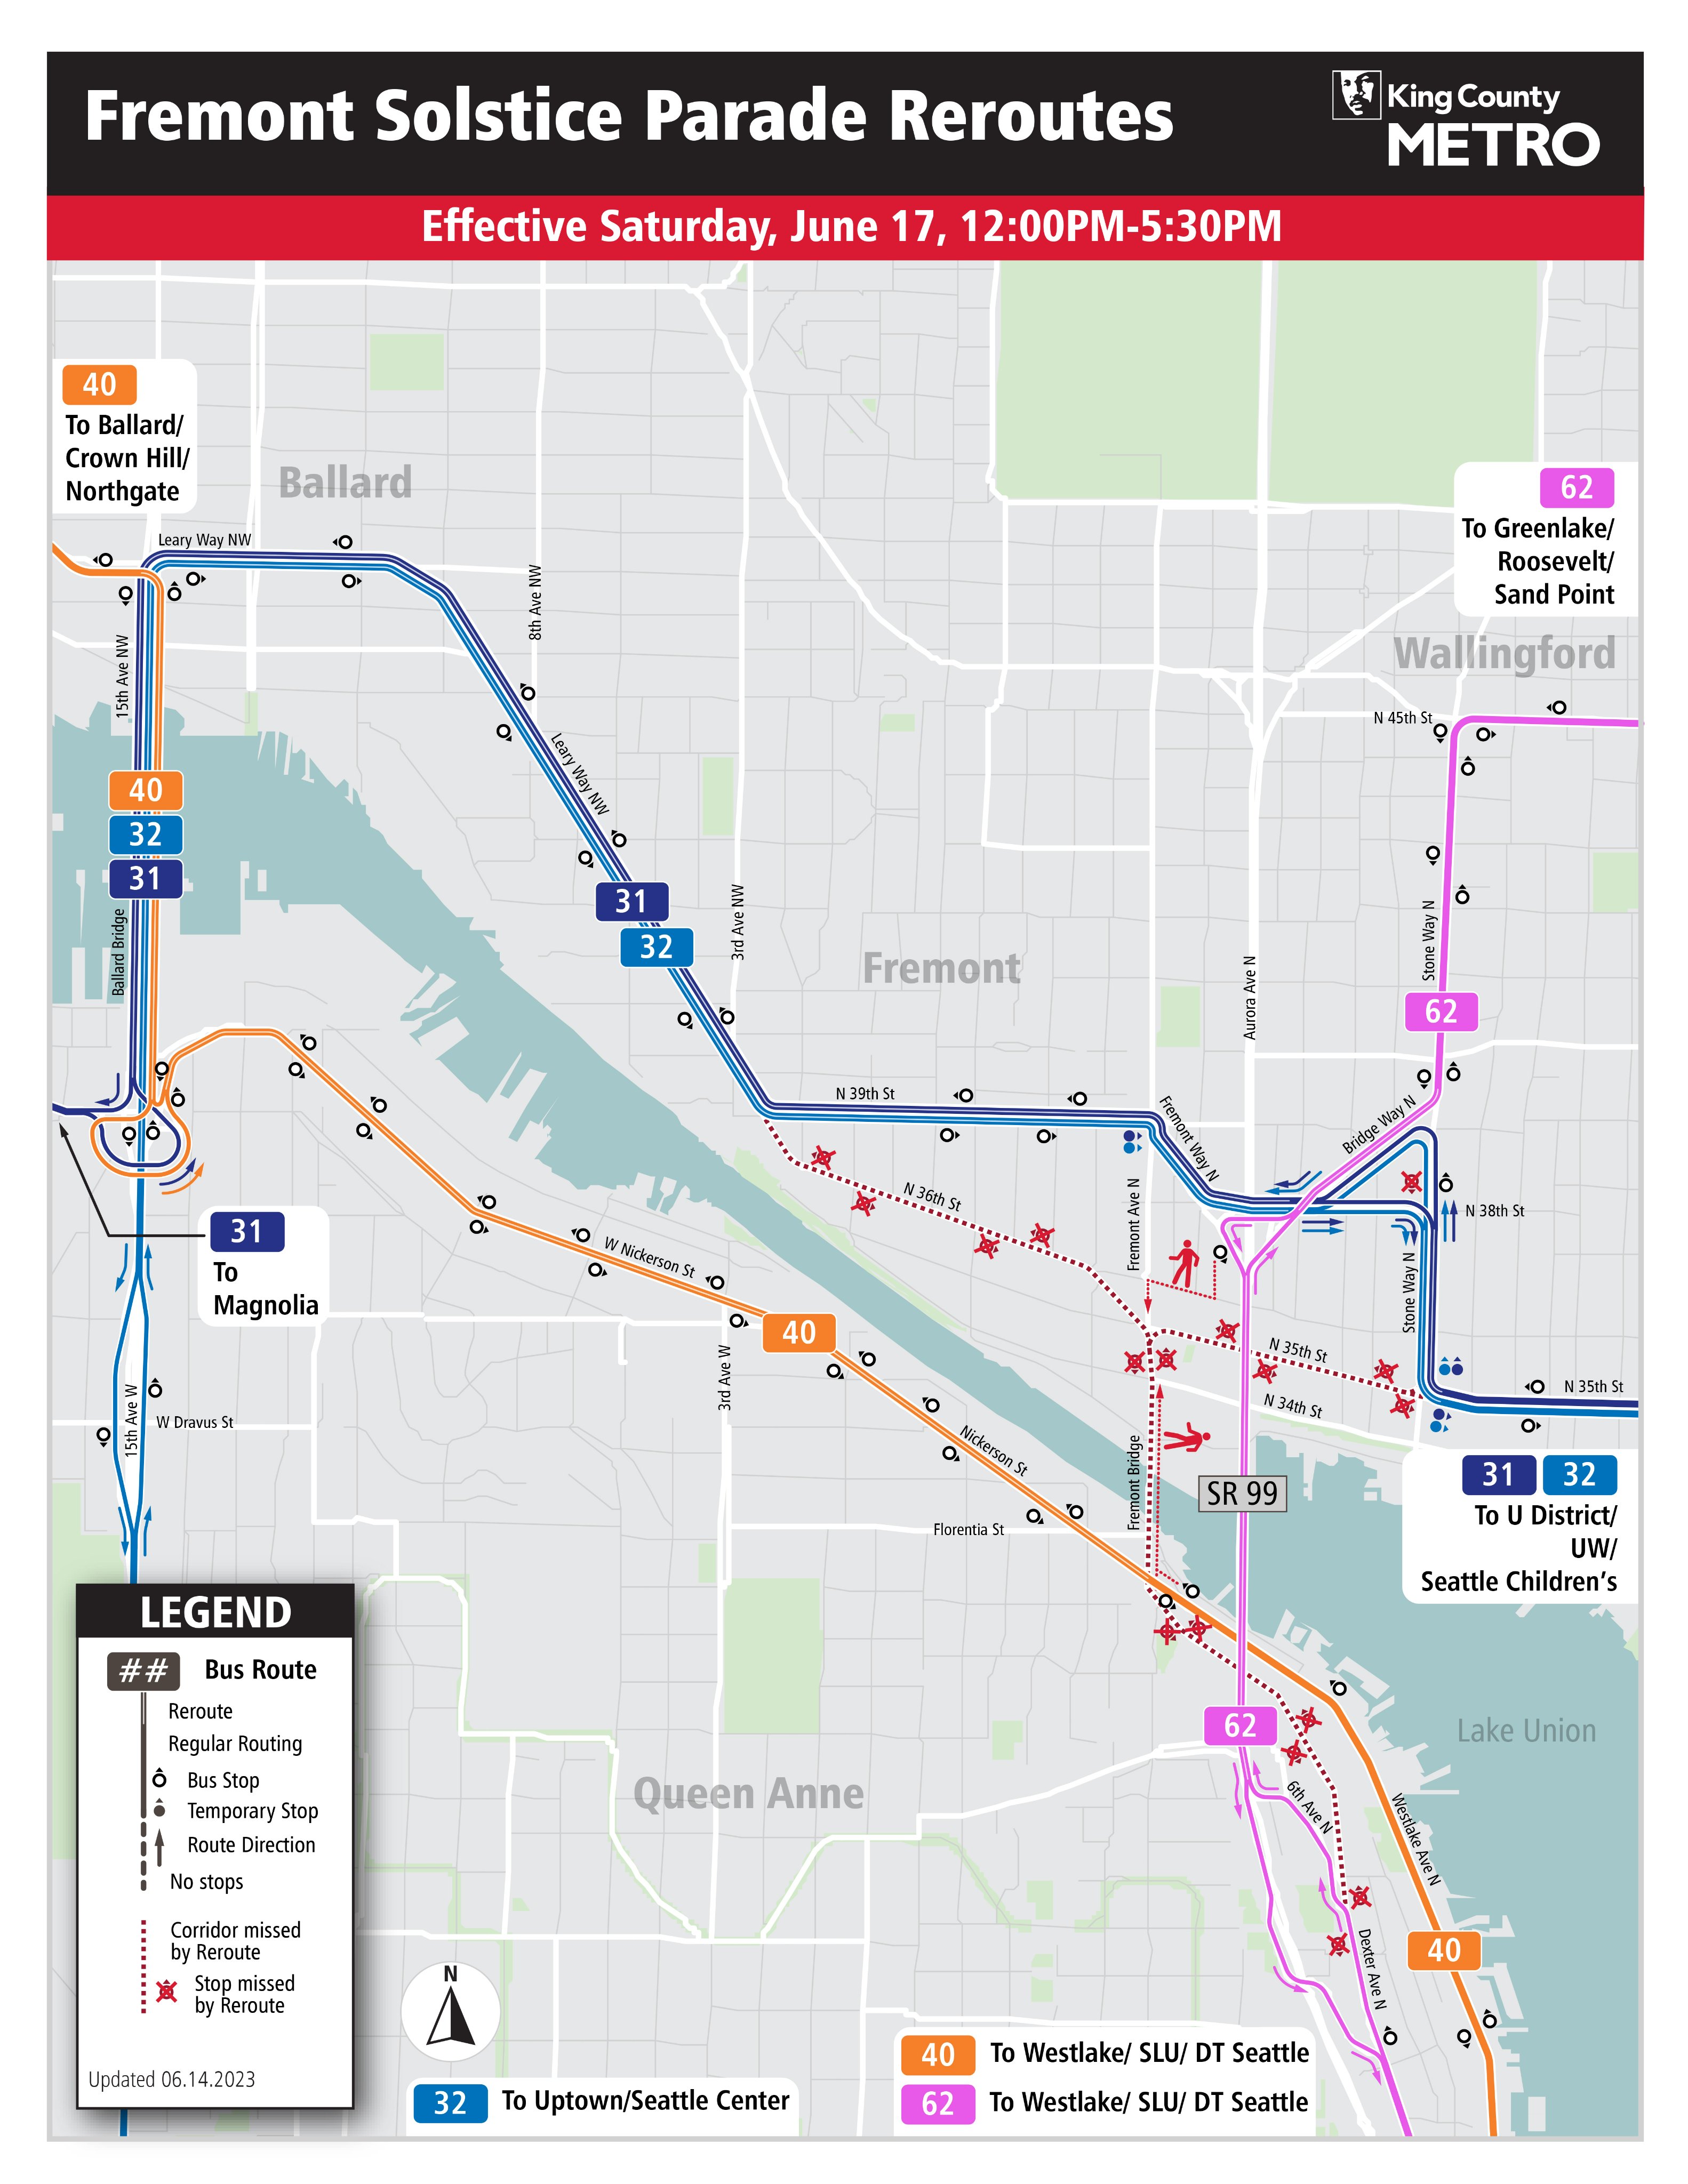
I was intrigued by the detours. The routes weren’t just avoiding the parade, they were bypassing the Fremont Bridge entirely. Mass transit has used the Fremont Bridge since its opening in 1917. It was built with two lanes of streetcar tracks on it. In spite of this precedent, I couldn’t help but wonder if Metro’s service could be better if no routes crossed it at all.
The Fremont Bridge is a low bascule bridge. Owing to that, and its location in the Lake Washington Ship Canal, it opens, on average, 35 times per day. This makes it the most frequently opened drawbridge in the United States. The buses that cross it have ample opportunities to get stuck and delayed, introducing unreliability throughout their entire routes. Even when it is closed, it can be a source of delay. It is among only a few crossings of the canal, often gets congested with vehicle traffic, and has no transit-priority features.
Is this a problem in practice, though? Metro tracks the on-time performance of its bus routes, but the information is not available in a particularly granular (or pleasant to navigate) way. Judging from a cursory scan, the four routes that cross the bridge aren’t terribly out of step with the others. In June 2024, these routes managed 73.3% on-time performance, compared to a system-wide average of 76.8%. Metro sets a goal of 80% on time performance. Eliminating the Fremont Bridge crossing seems unlikely not to improve this, perhaps letting these routes collectively hit Metro’s goal.
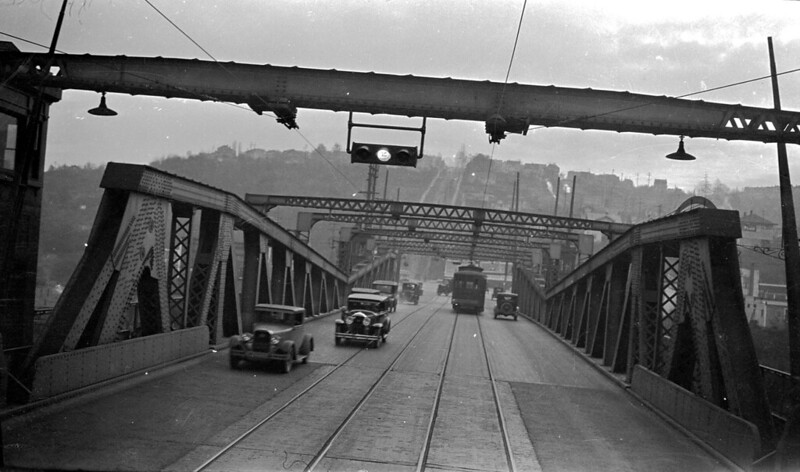
“Fremont Bridge, 1927” by Seattle Municipal Archives is licensed under CC BY 2.0.
Any reliability improvement would be offset by a loss of convenience for those bound for, or leaving, Fremont. All of these routes would no longer make a stop in the center of Fremont’s main commercial district. But a transit route doesn’t have to stop right in front of a destination to provide access to it. Unlike the impact on reliability, the access implications of bypassing the bridge are easy to measure.
I created a modified transit network, based on Metro’s present weekday one. In it, I rerouted routes 31, 32, 40, and 62 in ways similar to Metro’s Solstice Parade detours. The headways and spans of the routes remain the same, since the start times of each trip are unchanged.
Then, I computed access measurements with 20, 30, and 45 minute time budgets for the new network. The results do not point to a straightforward course of action, and they add depth to the discussion surrounding access.
Routes 31 and 32
I deviated the most from Metro’s reroutes with routes 31 and 32, allowing them to stay closer to Fremont’s main commercial district. Since this experiment concerns avoiding the Fremont Bridge—not the entire parade route—I maintained the routes’ path on North 35th Street west of Stone Way North, and had them take over Route 40’s stops on North 36th Street. Upon reaching Leary Way Northwest, the routes rejoin Metro’s reroute. I also added one new stop, on the portion of West Nickerson Street serving as a flyover and entrance ramp for 15th Avenue West. Located before the ramp to the latter splits off to the east, it allows eastbound route 31 trips to connect with the D Line or route 40 at this stop. Otherwise a rider would need to cross the Ballard Bridge twice to go further eastbound or southbound.
While I was largely able to use Metro’s existing timetables to generate schedules for the modified routes, there were several cases where I needed to approximate the time between stops. For westbound trips, I allocated one minute to get from the westbound Troll Avenue North stop on North 35th Street to the Dayton Avenue North stop on North 36th Street, two minutes to get between the westbound 11th Avenue Northwest stop on Leary Way Northwest and the southbound stop entering the Ballard Bridge, and three minutes from that stop to the westbound 21st Avenue West stop on West Emerson Place. For eastbound trips, I allocated two minutes to reach the added stop from the eastbound 21st Avenue West stop on West Emerson Place, three minutes to get from that new stop to the eastbound 15th Avenue Northwest stop on the far side of Leary Way Northwest, and two minutes to get from the eastbound Phinney Avenue North stop on North 36th Street to the eastbound Troll Avenue North stop on North 35th Street. For route 32 eastbound, it was necessary to provide an approximation for one additional stop pair. I allocated three minutes to get from the northbound stop on 15th Avenue Northwest before the Ballard Bridge to the first stop on Leary Way Northwest after crossing it.
These changes cause these routes to no longer serve the northernmost part of Queen Anne. By exchanging this segment for a connection between Fremont and Ballard, routes 31 and 32 end up roughly paralleling route 44 when they run concurrently.
Route 40
While my treatment of routes 31 and 32 differs materially from Metro’s Solstice Parade detour, route 40 is an exact copy of it. It takes over the service on Nickerson street west of the Fremont Bridge, once provided by routes 31 and 32. No new stops are added. For northbound trips, 40 seconds are allocated between its current last stop before the Fremont bridge and the first stop of its new path on Nickerson Street, and three minutes are given to serve stops on either side of the Ballard Bridge. In the southbound direction, it takes 90 seconds to go between the westbound Ione Place Northwest stop on Leary Avenue Northwest and the stop at the southbound entrance of the Ballard Bridge, two minutes to reach the stop at West Emerson Street and West Nickerson Street from there, and 40 seconds to get from Nickerson Street and Florentia Street to Westlake Avenue North and Dexter Avenue North.
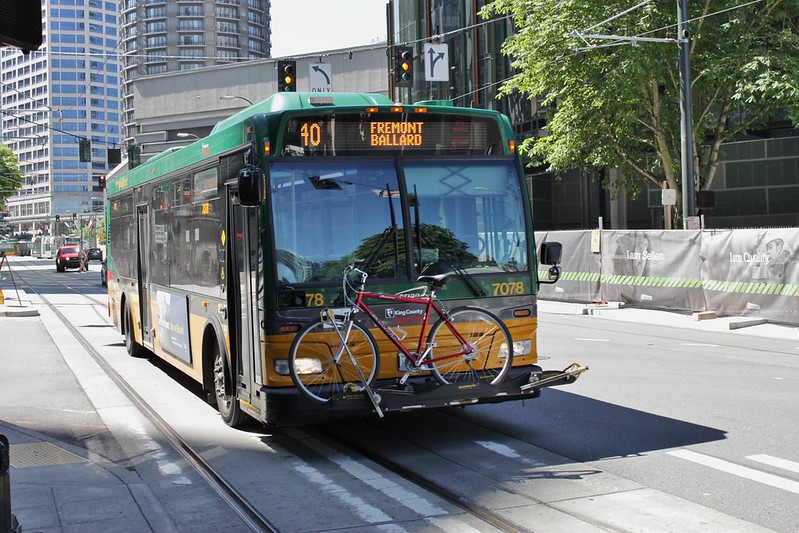
“KCM 7078 in Downtown Seattle” by SounderBruce is licensed under CC BY-SA 2.0.
As a result, a direct connection between Downtown Seattle and Fremont’s core has been lost, an exchange for a more direct route from downtown to the northernmost part of Queen Anne. The reroute also provides an all-day connection between that area and Ballard that was once provided—but only at rush hours—by route 29. For those with a fondness of old King County Metro routes, its routing between the Ballard Bridge and downtown should evoke the erstwhile non-express variant of route 17.
Route 62
Route 62’s routing is the same in this experiment and in Metro’s detours, but I added some new stops along its paths onto and off of Aurora Avenue North. These give riders new opportunities to transfer to the routes running on that corridor.
Going north, route 62 abandons its current path after Dexter Avenue North and Crockett Street. It uses 6th Avenue North and Halladay Street to reach Aurora Avenue North, making a stop on the latter. After proceeding north on Aurora, it exits at Bridge Way North, serving a now-abandoned stop once used by route 26. It resumes its traditional route at Stone Way North and North 40th Street. These maneuvers take two and a half minutes, two minutes, and two minutes, respectively. Going south, it departs from its present route after stopping at Stone Way North and North 40th Street. It uses Bridge Way and North 38th Street to reach Aurora Avenue North southbound, serving a stop currently used by routes 5 and 28. Then, it leaves Aurora Avenue North at Dexter Way North, serving a new stop as that road curves under the highway. It rejoins the current route at Dexter Avenue North and Crockett Street. The times between these stops are two minutes, three minutes, and one minute, respectively.
As a result of avoiding the Fremont Bridge, the northern part of Dexter Avenue North loses its transit service altogether. The route also bypasses the core of Fremont, but still stops on its periphery.
Assessing this Network
This network provides worse access than King County Metro’s current one. For 30-minute trips, the overall access score is 0.0987 versus 0.0988. This is a change of only 0.11%, though. It also results in a reduction of in-service time by .16%, or 7 hours, 57 minutes, and 15 seconds.
In theory, the in-service time reduction could be used to run more service, which could, in turn, boost access. Each trip of each route requires a different amount of service time to run. The table below provides some rough estimates of how many one-way trips could be added if all the extra time were allocated to one route. These are slight overestimates, since trips that are near the beginning and end of the span of the calculation do not have their full service hours counted, since they fall outside of the time range used in the calculation.
| Route | In-Service Time | Trips | Time Per Trip | Possible Additional Trips |
|---|---|---|---|---|
| 31 | 57 hours, 9 minutes, 2 seconds | 73 | 46 minutes, 59 seconds | 10 |
| 32 | 67 hours, 42 minutes, 40 seconds | 91 | 44 minutes, 38 seconds | 10 |
| 40 | 195 hours, 5 minutes, 18 seconds | 184 | 1 hour, 3 minutes, 37 seconds | 7 |
| 62 | 156 hours, 24 minutes, 25 seconds | 163 | 57 minutes, 35 seconds | 8 |
While the extra in-service time available could extend peak service periods, or provide some overnight trips, I don’t see the potential to radically change the overall frequency of any route. Determining the best way to use these resources is beyond the scope of this post.
Breaking the access down spatially reveals a range of outcomes that the small change in overall access hides.
The largest access reduction is located at the northern approach of the Fremont Bridge, sector 19213, which contains a southbound bus stop currently served by the four modified routes. Without transit routes directly serving this sector anymore, it sees an access score decrease of 20.0%, from .1734 to .1387. That 20% drop is significant, but it hardly means that Fremont is cut off from transit. The access to it is still 0.91 standard deviations above the mean location in Seattle. Even though there’s no longer direct transit service, the nearby stops make it easier to access than transit stops in Eastlake and much of the Central District. At the same time, the current access is 1.6944 standard deviations above average, so it would also be inaccurate to say that the change is inconsequential.
To understand the impact in more detail, I recorded how often each route occurred on journeys that originated from, or reached, sector 19213. Consider the top ten routes that make up the fastest path to the sector in the current network in the table below. Unsurprisingly the four routes slated for removal from the area make up four of the top five routes. Route 5 appears more often than route 31, but this could be the result of there being more route 5 trips throughout the day than route 31 trips.
| Route | Inbound Count | Inbound % of All | Outbound Count | Outbound % of All |
|---|---|---|---|---|
| 40 | 2,255,741 |
27.8% |
1,708,612 |
21.1% |
| 62 | 1,602,831 |
19.7% |
1,473,117 |
18.2% |
| 32 | 884,208 |
10.9% |
1,047,087 |
12.9% |
| 5 | 740,598 |
9.1% |
964,561 |
11.9% |
| 31 | 795,389 |
9.8% |
864,271 |
10.7% |
| 28 | 346,232 |
4.3% |
443,977 |
5.5% |
| E Line | 330,457 |
4.1% |
370,094 |
4.6% |
| D Line | 247,419 |
3.0% |
234,701 |
2.9% |
| 44 | 201,971 |
2.5% |
181,841 |
2.2% |
| 1 Line | 92,907 |
1.1% |
90,853 |
1.1% |
Even after the route modifications, route 40 remains on top for combined inbound and outbound journeys to this part of Fremont. If one goal of this restructure is to make reaching Fremont more resilient to bridge openings, this result indicates failure. Many of these journeys involve taking route 40 close to the Fremont Bridge, and now crossing it on foot instead of riding across. If the bridge is open, a delay will happen regardless of mode.
| Route | Inbound Count | Inbound % of All | Inbound Count Delta % | Outbound Count | Outbound % of All | Outbound Count Delta % |
|---|---|---|---|---|---|---|
| 40 | 1,121,746 |
17.6% |
-50.3% |
1,191,988 |
18.0% |
-30.2% |
| 5 | 1,012,552 |
15.9% |
36.7% |
1,086,623 |
16.4% |
12.7% |
| 62 | 764,646 |
12.0% |
-52.3% |
758,202 |
11.5% |
-48.5% |
| 32 | 609,620 |
9.6% |
-31.1% |
690,006 |
10.4% |
-34.1% |
| 31 | 563,281 |
8.9% |
-29.2% |
544,684 |
8.2% |
-37.0% |
| 28 | 540,283 |
8.5% |
56.0% |
542,216 |
8.2% |
22.1% |
| E Line | 265,491 |
4.2% |
-19.7% |
324,603 |
4.9% |
-12.3% |
| D Line | 265,742 |
4.2% |
-19.6% |
222,385 |
3.4% |
-5.2% |
| 44 | 168,757 |
2.7% |
-16.4% |
130,473 |
2.0% |
-28.2% |
| 21 | 395 |
0.0% |
-44.4% |
179,502 |
2.7% |
26.0% |
On the other hand, the ascendence of routes 5 and 28—both in terms of the absolute journey count and the percentage of total journeys—demonstrates a way that the rest of the network can partially absorb the loss of direct access to Fremont’s commercial core. The routes that exit Aurora Avenue North at North 38th Street can reasonably be utilized as a path to and from Fremont. Given that, it would be interesting—but beyond the scope of this post—to contemplate the access implications of having the extremely frequent E Line stop in the vicinity of North 38th Street as well. Likely, it would mitigate the access loss to Fremont somewhat.
The level of diminishment for routes 31 and 32 for accessing this sector surprised me somewhat, since these routes continue to make stops on North 35th Street and North 36th Street, not far from it. Route 62’s predictable decrease—the most severe of the group—seems to reflect the greater distance that its routing is moved from this sector.
Outside of this sector, Fremont sees a less severe version of the reduction, and it extends to the east along the combined 31 and 32 route. An easy transfer point in Fremont no longer exists, so the breadth of destinations available to riders coming from the east are reduced. With a limited time budget, remaining on the bus until it reaches transfer opportunities in Ballard may not be an option.
The area immediately south of the Fremont bridge also sees an access reduction. Some of this is due to the abandonment of some route 62 stops on Dexter Avenue North. Immediately southwest of the bridge, the introduction of route 40 increases frequency; this should boost access. The removal of a nearby transfer opportunity that used to exist in Fremont offsets this, however, leading to a net reduction.
In general, Ballard and its environs see in access increase. The northern and southern ends of the Ballard Bridge—in spite of subpar pedestrian infrastructure at the latter—have become more significant transfer points, providing an access improvement. This extends into the portion of north Queen Anne between the bridge and Seattle Pacific University; a major transfer point is now closer. Improvements along Dexter Avenue North and Westlake Avenue North in the Westlake neighborhood seem to largely be the residue of an easier connection to the D Line on route 40, and a faster route 62. The improvements never have the comparable magnitudes to the worst losses, though.
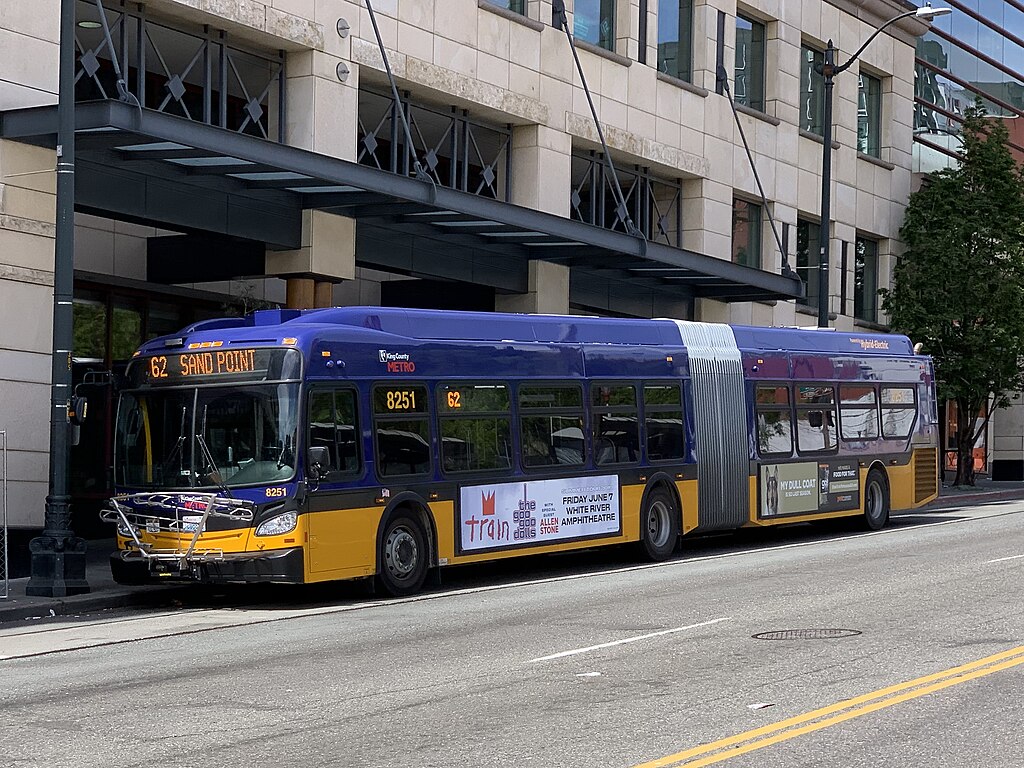
“King County Metro XDE60 8251” by Saucy is licensed under CC BY 4.0.
For a 45-minute time budget, the comparison map looks largely the same, though the magnitude of reduction along the northern portion of Dexter Avenue North has gotten closer the reduction in Fremont. A 20-minute budget resembles the 30-minute version as well. In all, this change is unlikely to be a total disaster for transit riders in Fremont, but it’s far more consequential than its small shift in overall access suggests.
Contemplating the Outcome
This experiment reduces transit access to Fremont without providing commensurate access increases elsewhere. If it were to actually be proposed, I wouldn’t envy the communications personnel at Metro tasked with presenting it to riders. From an access perspective, there is no good way to sell this change. The genesis of these modifications wasn’t an outright attempt at improving access, though. It was about reliability.
When a transit route is unreliable, its schedule no longer reflects the reality of its operations. Do King County Metro’s schedules reflect reality? More importantly, can they reflect reality? Metro runs buses in mixed traffic, and those buses are operated and ridden by human beings whose actions do not always prioritize schedule adherence. Nevertheless, Metro can make choices that reduce systemic deviation from the schedule. Avoiding a frequently-opened bridge is in this category. Making these choices increases the ability of a single timetable to describe what will happen on a given day.
This would allow a more acute assessment of access. There has been an unspoken assumption in every access calculation. They rely on agencies’ schedules being a generally accurate depiction of the transit service that operates every day. In reality there is a distinction between the singular access amount suggested by the schedule, and the actual access that depends on the transit service that runs on a given day. The more unreliable the network, the more uncertain any assessment of access becomes.
A network change, like this one, could appear to decrease the access based off of the schedule, but could reduce the uncertainty of the measurement. How much of one quantity is reasonable to exchange for the other? I can’t answer that question. First, I lack the tools to assess how much access varies. Even if I had them, how much of one to exchange for the other is a judgement call without a general answer.
Is it possible to call this specific network modification a good exchange, though? I devised this experiment imagining that it could result in minimal losses of access, even in Fremont. If that were the case, I’d suggest making it, even without knowing how much variability was actually tamped down. But that’s clearly not the case; schedule data suggests that there would be a considerable loss. After thinking about the idea of reliability interacting with access, though, I’m not satisfied with just suggesting it not be made. Maybe reality is already making access to Fremont worse than this proposal ever would. Contemplating this change to routes 31, 32, 40, and 62 has opened a door to future research.